
Before you start
Before creating an experiment, run through this checklist:- All funnels you plan to use are new (have never received traffic) and are published.
- Each funnel works end to end.
- You’ve decided which funnel is the control — your current baseline.
- You’ve chosen a primary metric to optimize for (e.g. Paywall → Purchase, ARPU).
- You have a clear hypothesis — what you’re changing and why you expect it to improve results.
Launch experiments
Create, launch, and validate an experiment in FunnelFox. Learn how to avoid the most common setup mistakes.1. Create experiment
Go to the Experiments page and click Create experiment.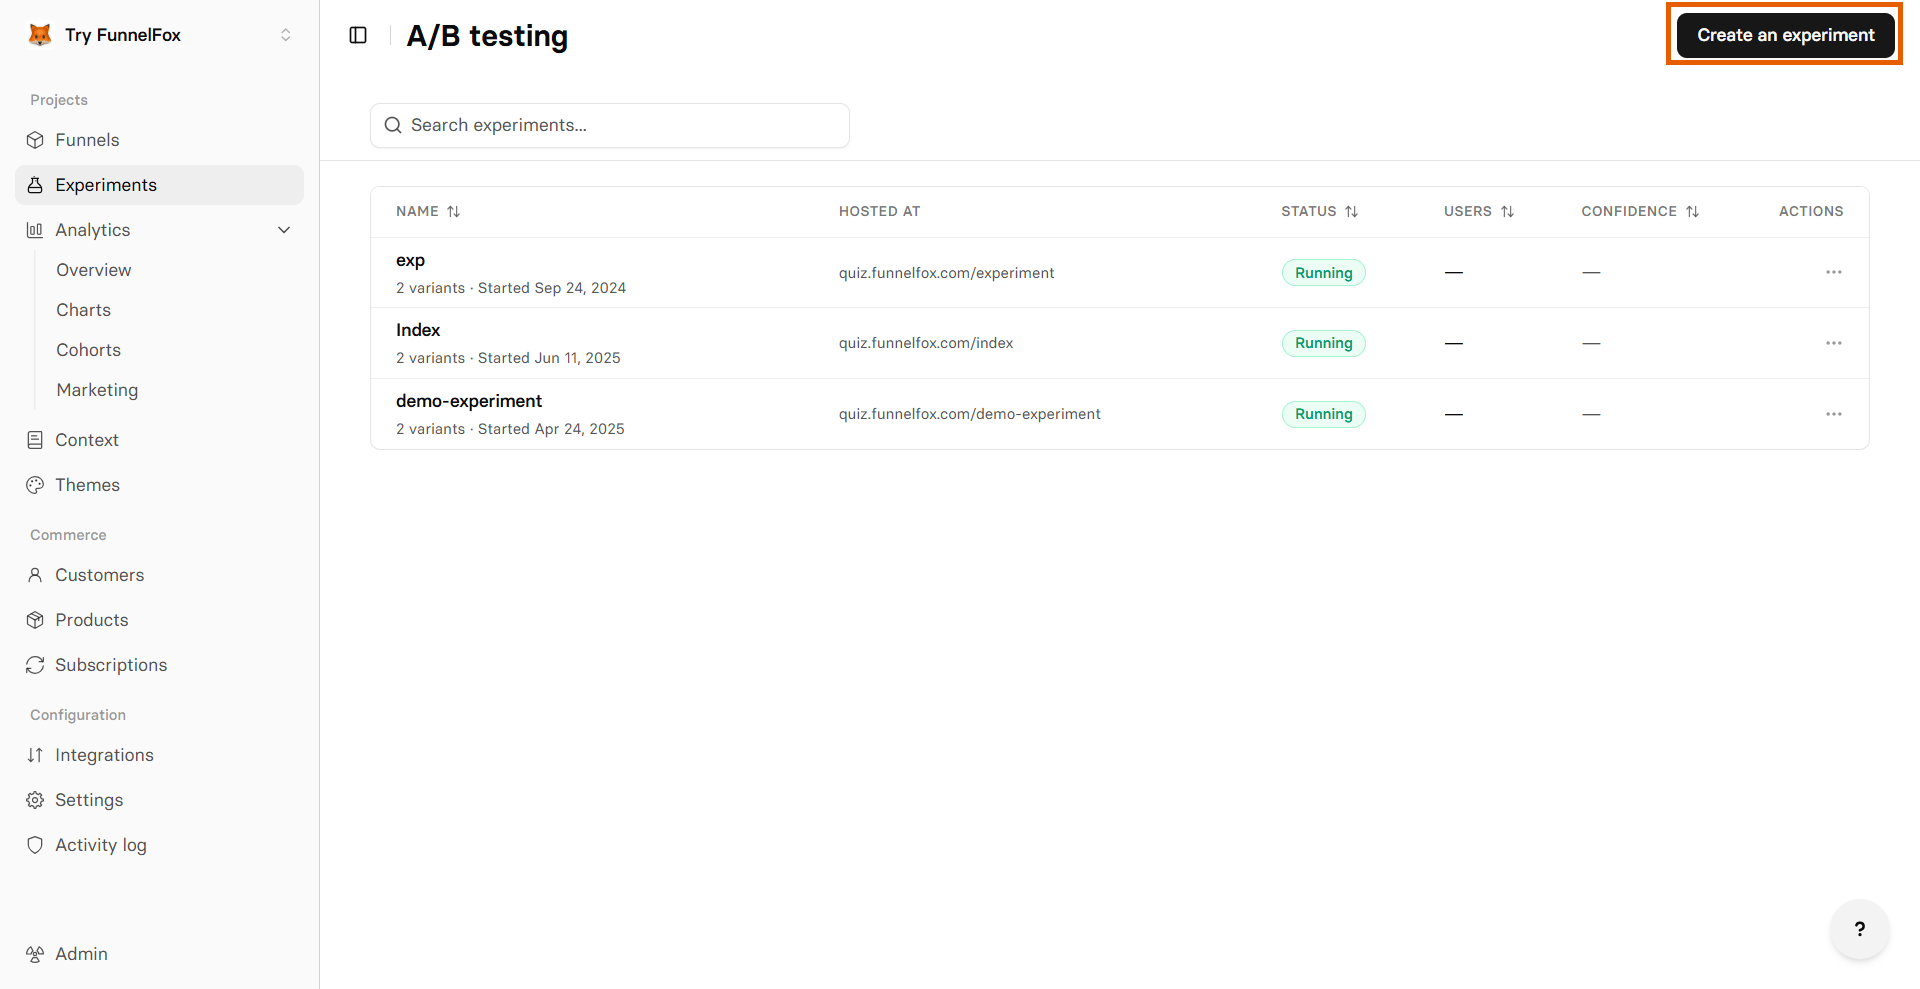
1
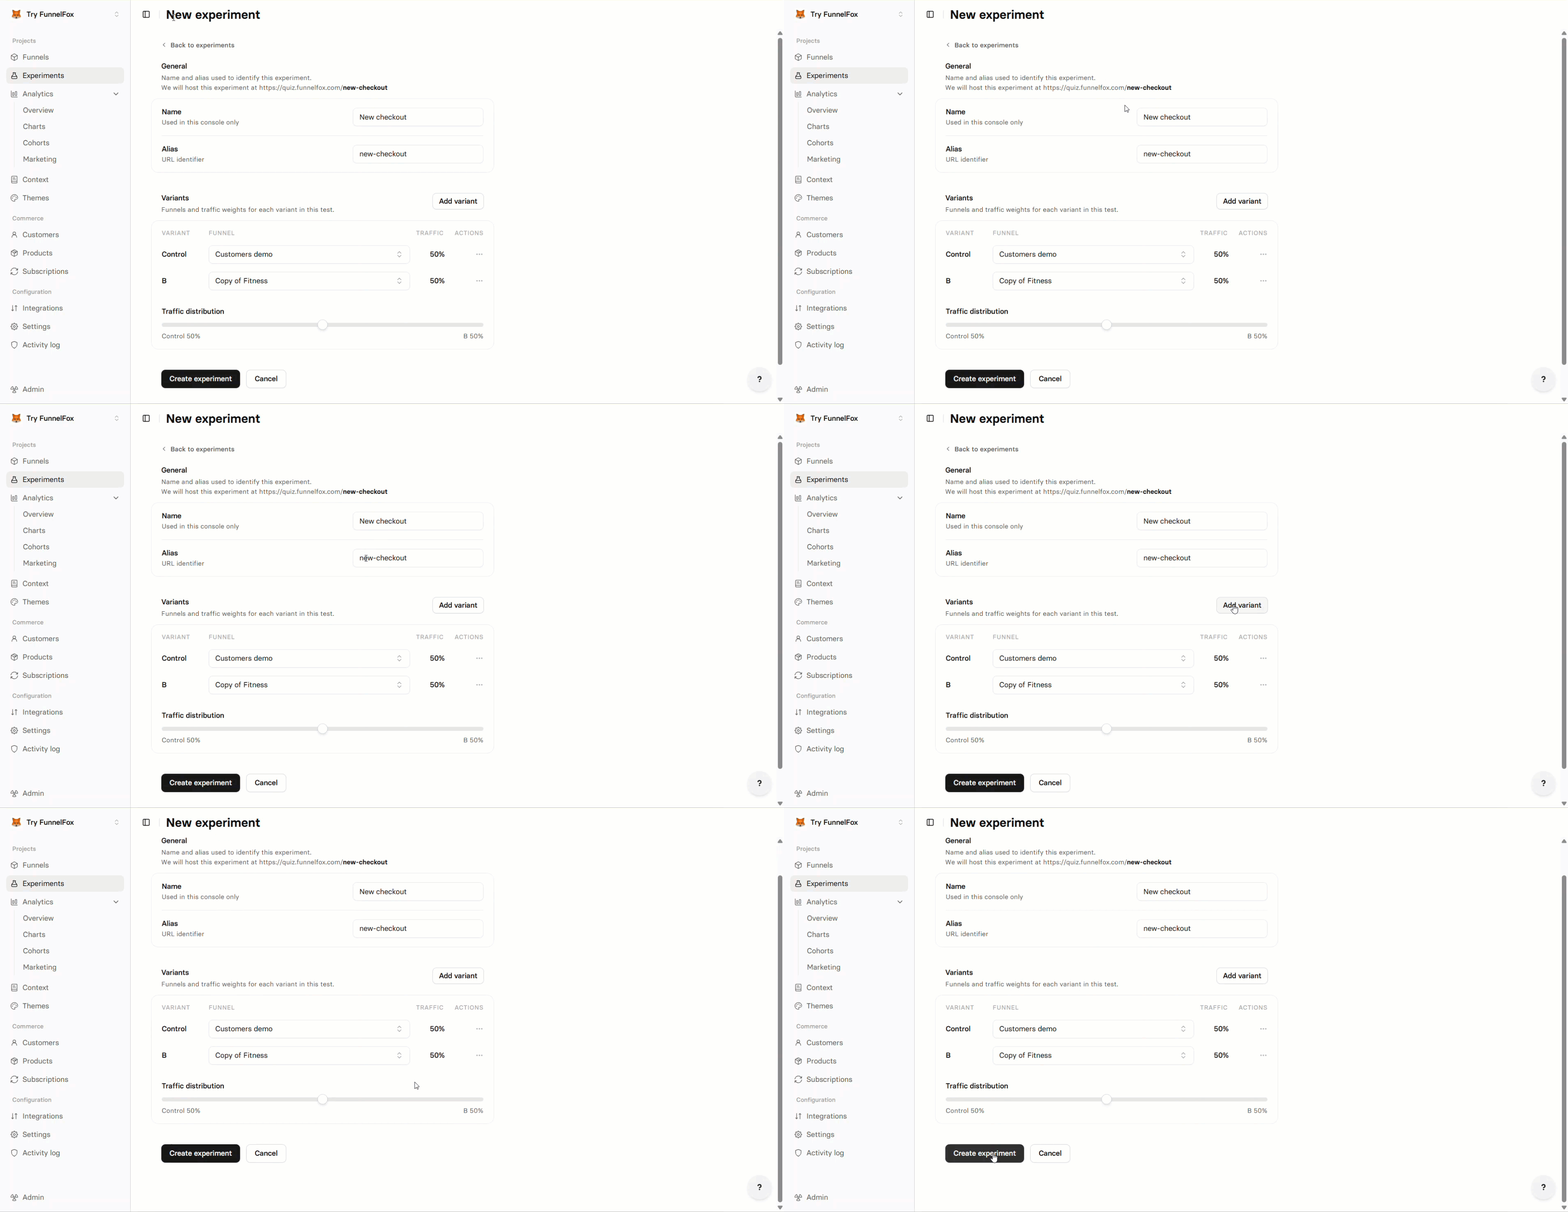
Name the experiment
Enter a descriptive name.
2
Set the alias
The alias becomes the experiment URL:
your-project.fnlfx.com/{alias}. It’s auto-generated from the name, but you can edit it.3
Select the control funnel
Choose the funnel that serves as your baseline. All variant results are measured against this funnel.
4
Add variants
Choose the funnel that serves as your variant. You can click Add funnel variant and add up to 3 variants — 4 funnels total (Control + B + C + D). Each funnel can only be used once across all variants in the same experiment.
5
Set the traffic split
Use the slider to distribute traffic across variants. All splits must total 100%.
6
Create
Click Create. The experiment is saved and receives traffic.
2. Validate the setup
Do a quick check to confirm everything is working:- Open the experiment URL in your browser (
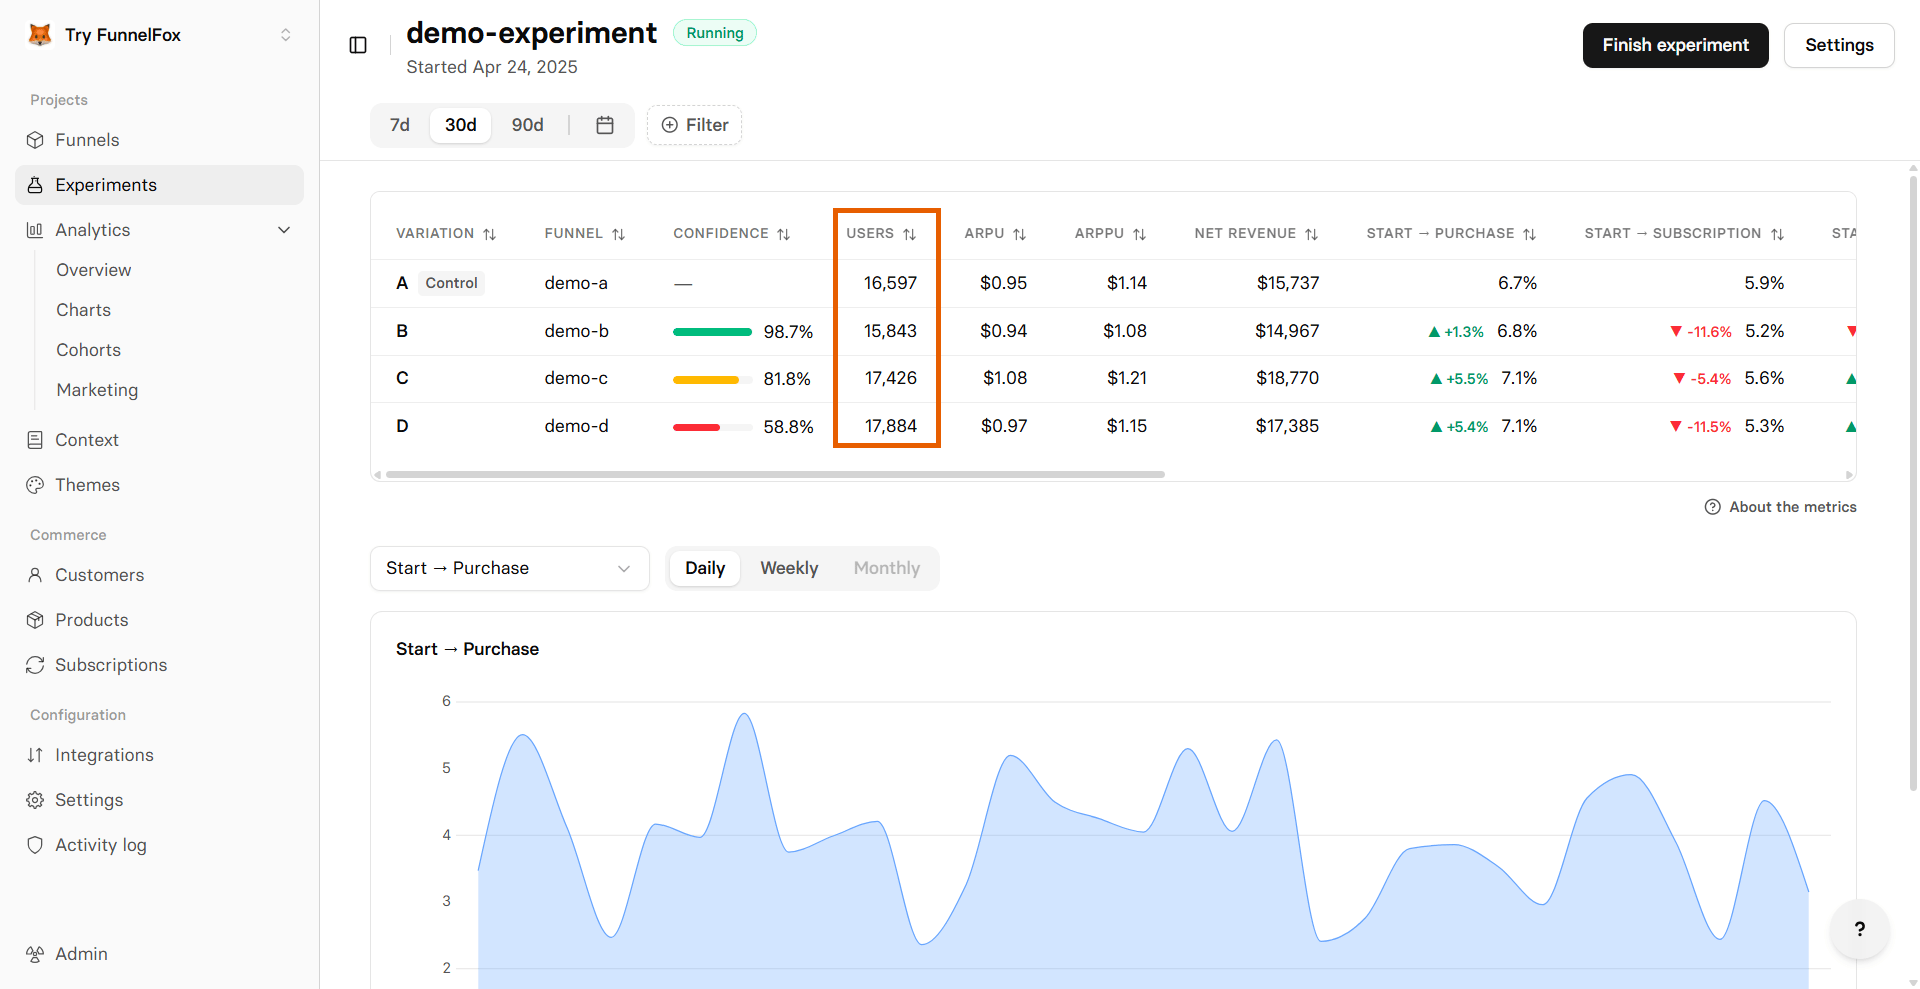
your-project.fnlfx.com/{alias}). You should land on one of the variant funnels. - After a few visits, open the experiment analytics and confirm users are being recorded.
3. Finish experiment
Finish the experiment when your results are statistically reliable. Look for a Confidence of ≥95% on the winning variant, sustained consistently over time — not just a single good day. If confidence stays green and the trend is stable, you have enough evidence to pick a winner. When you’re ready to pick a winner, follow the steps below to finish the experiment.1
Finish experiment
Go to the A/B testing page, click your experiment name, then click Finish experiment at the bottom.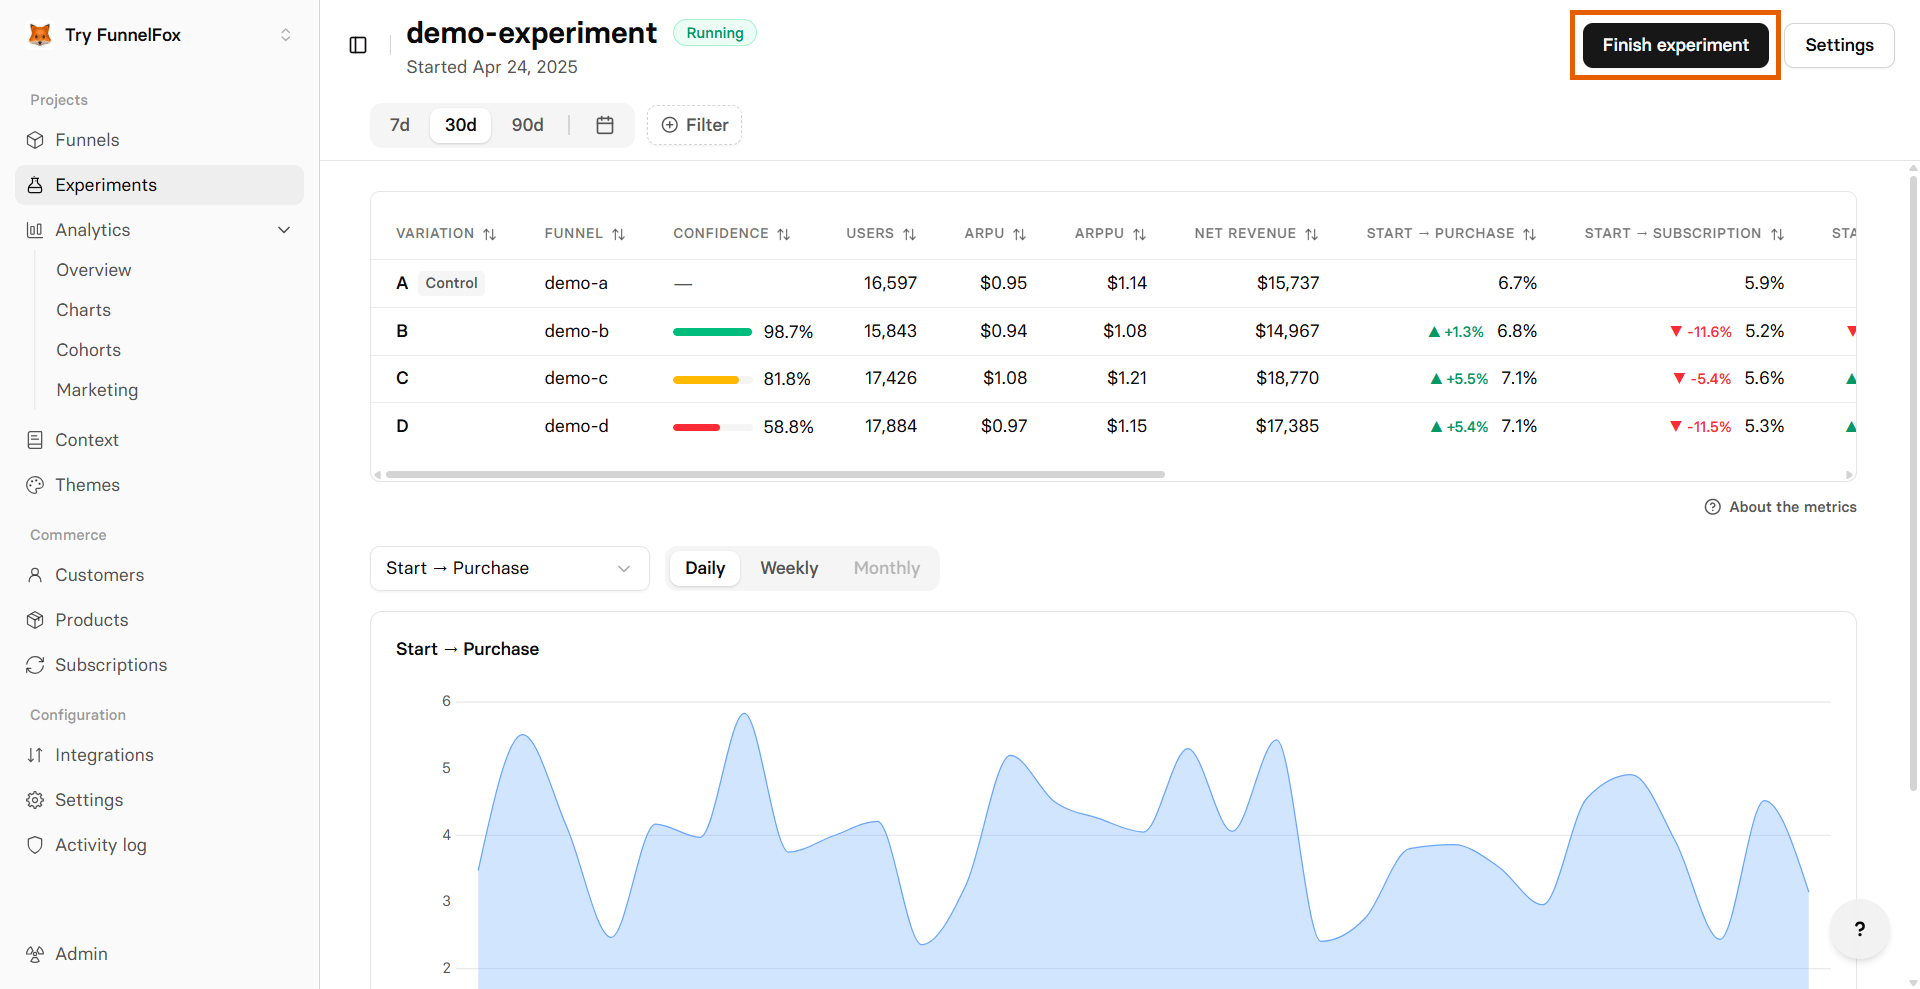
2
Select the winning variant
Choose the funnel that performed best. This funnel will take over the experiment URL.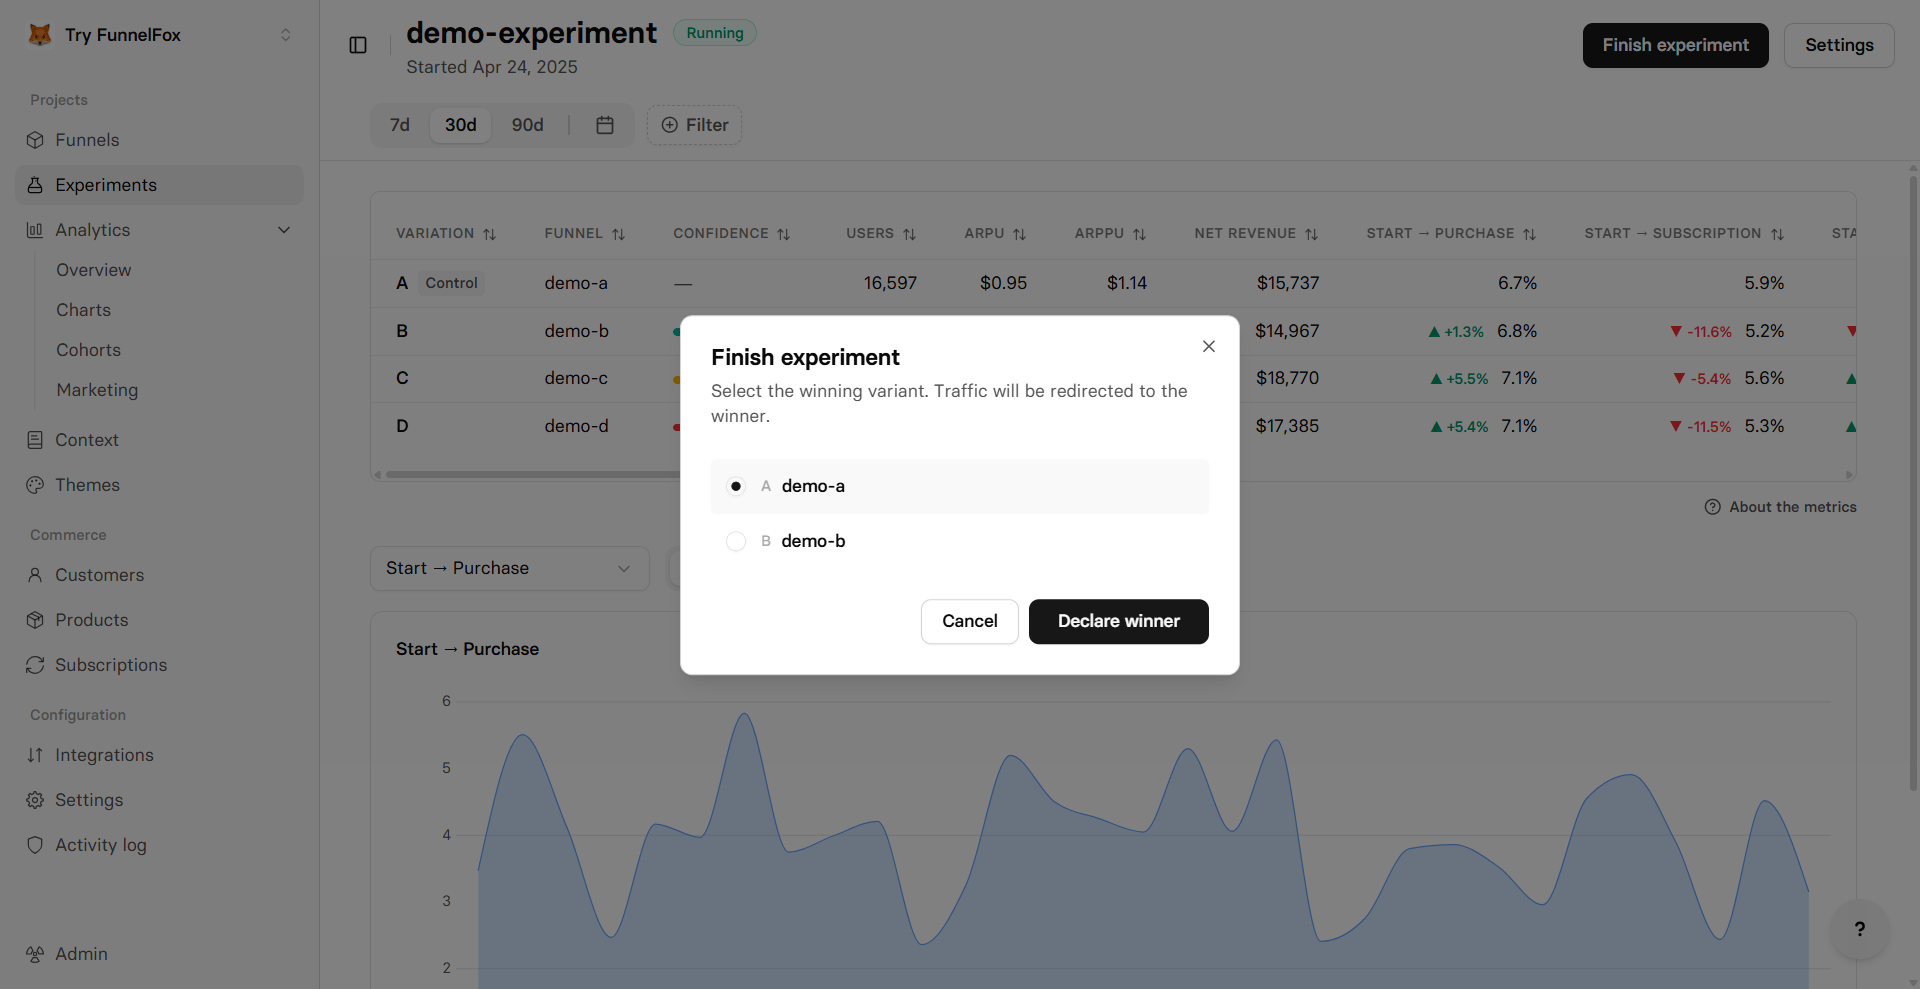
3
Confirm
Click Declare the winner to confirm your selection. The experiment is disabled and the winning funnel is now live at the experiment URL.After that, the same URL that previously ran the A/B test points directly to the winning funnel, with no experiment routing involved.
Experiment results
Once your experiment collects data, you can view results on the experiment overview page. Go to the Experiments page and click any experiment name. The overview shows a table with one row per variant. The first row is always the control (your baseline). All other variants are compared against it.Experiment starts updating data daily at 00:00 UTC to ensure consistency across global teams.
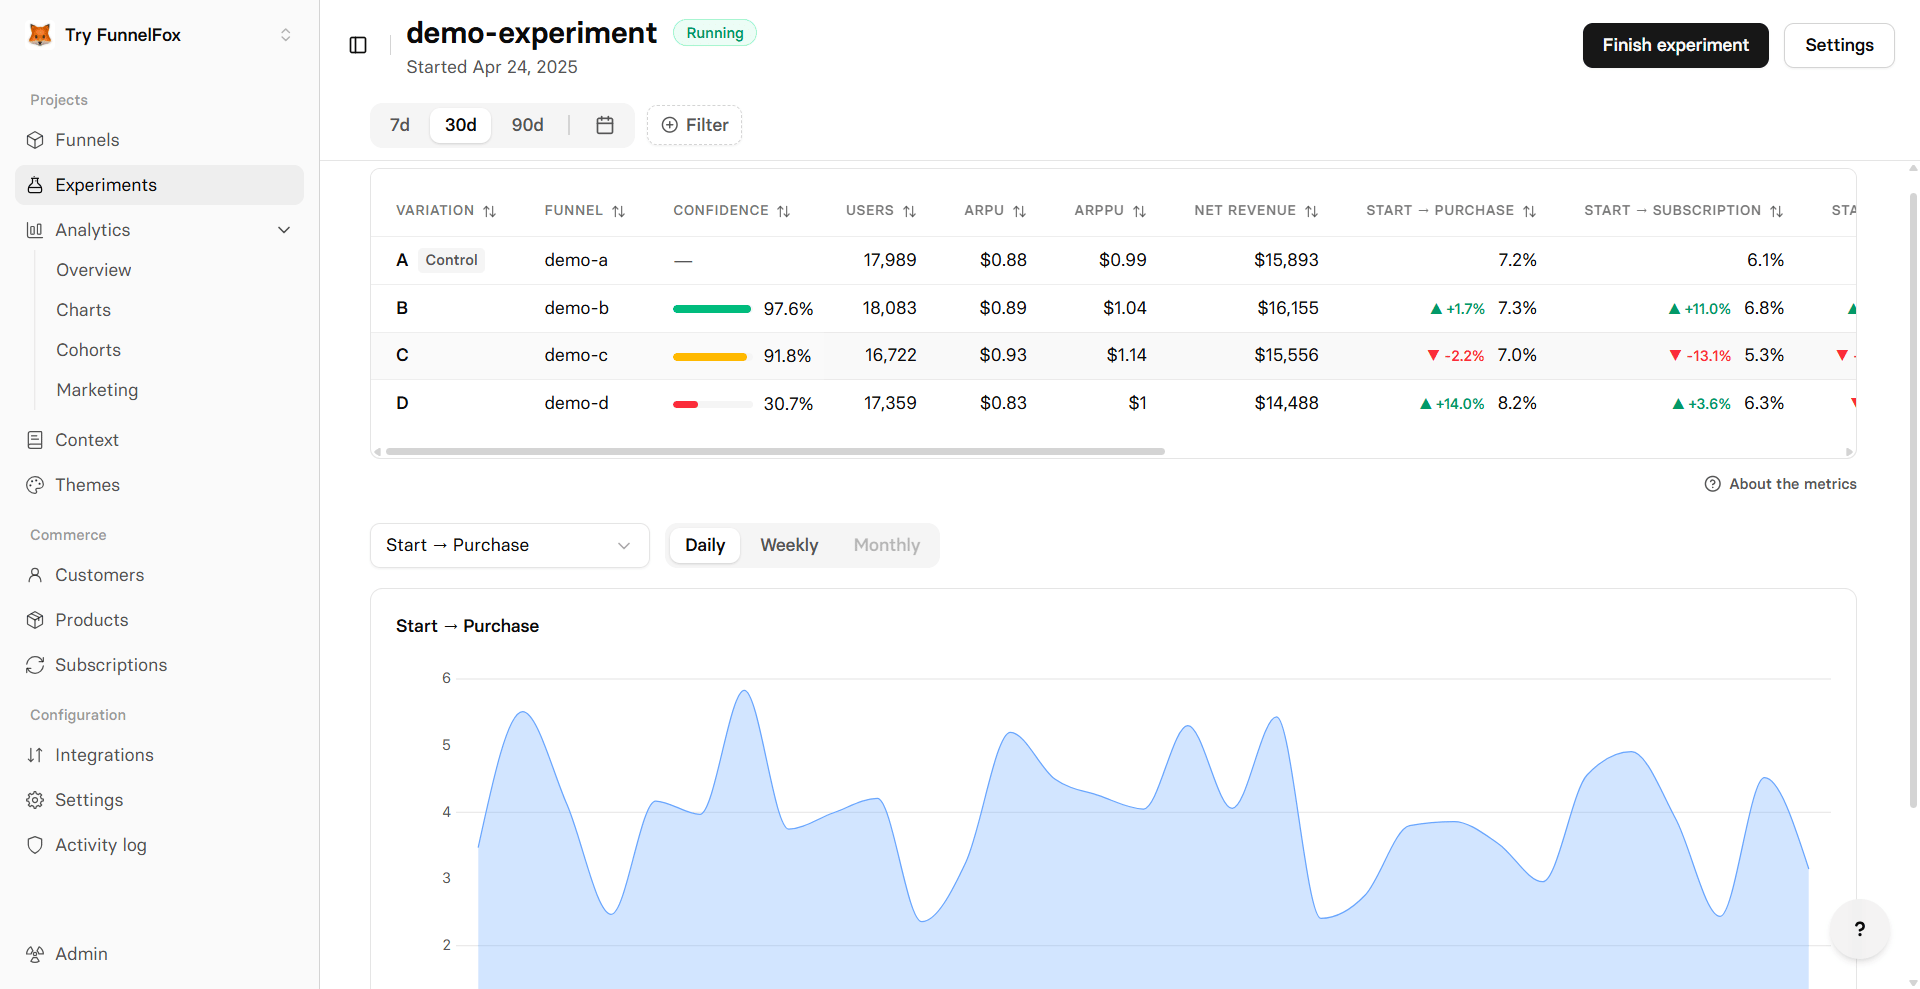
- Variation: Variant label (A, B, C, D).
- Funnel: The funnel assigned to this variant.
- Confidence: Statistical significance (1 − p-value) from a two-proportion z-test of the variant’s Active → Purchase conversion vs. control. ≥95% ≈ p ≤ 0.05. Color-coded: green (≥95%) = significant, amber (75–94%) = inconclusive, red (<75%) = likely noise. For non-control variants only.
- Users: Unique users, deduplicated by profile across sessions.
- ARPU: Average revenue per user (gross revenue divided by unique users, meaning anyone with a session or a transaction).
- ARPPU: Average revenue per paying user (gross revenue divided by unique paying users).
- Net Revenue: Total net revenue attributed to this variant.
- Start → 2nd Screen: Percentage of users who started the funnel and completed the first screen.
- Start → Purchase: Percentage of users who started the funnel and completed a purchase.
- Start → Subscription: Percentage of users who started the funnel and started a subscription.
- Start → Lead: Percentage of users who started the funnel and became a lead.
- Start → Paywall: Percentage of users who started the funnel and reached the paywall.
- Paywall → Purchase: Percentage of users who reached the paywall and completed a purchase.
- Purchases: Count of all purchase transactions, including renewals.
- New Subs: Number of new subscriptions started.
- Trials Started: Number of trials started.
- Trials Converted: Number of trials that converted to paid.
Filters
To narrow results to those that matter for your decisions, data on experiment results can be filtered by:- Currency
- Country
Experiment settings
To edit an experiment, go to the Experiments page, click your experiment name, then click Settings at the top right.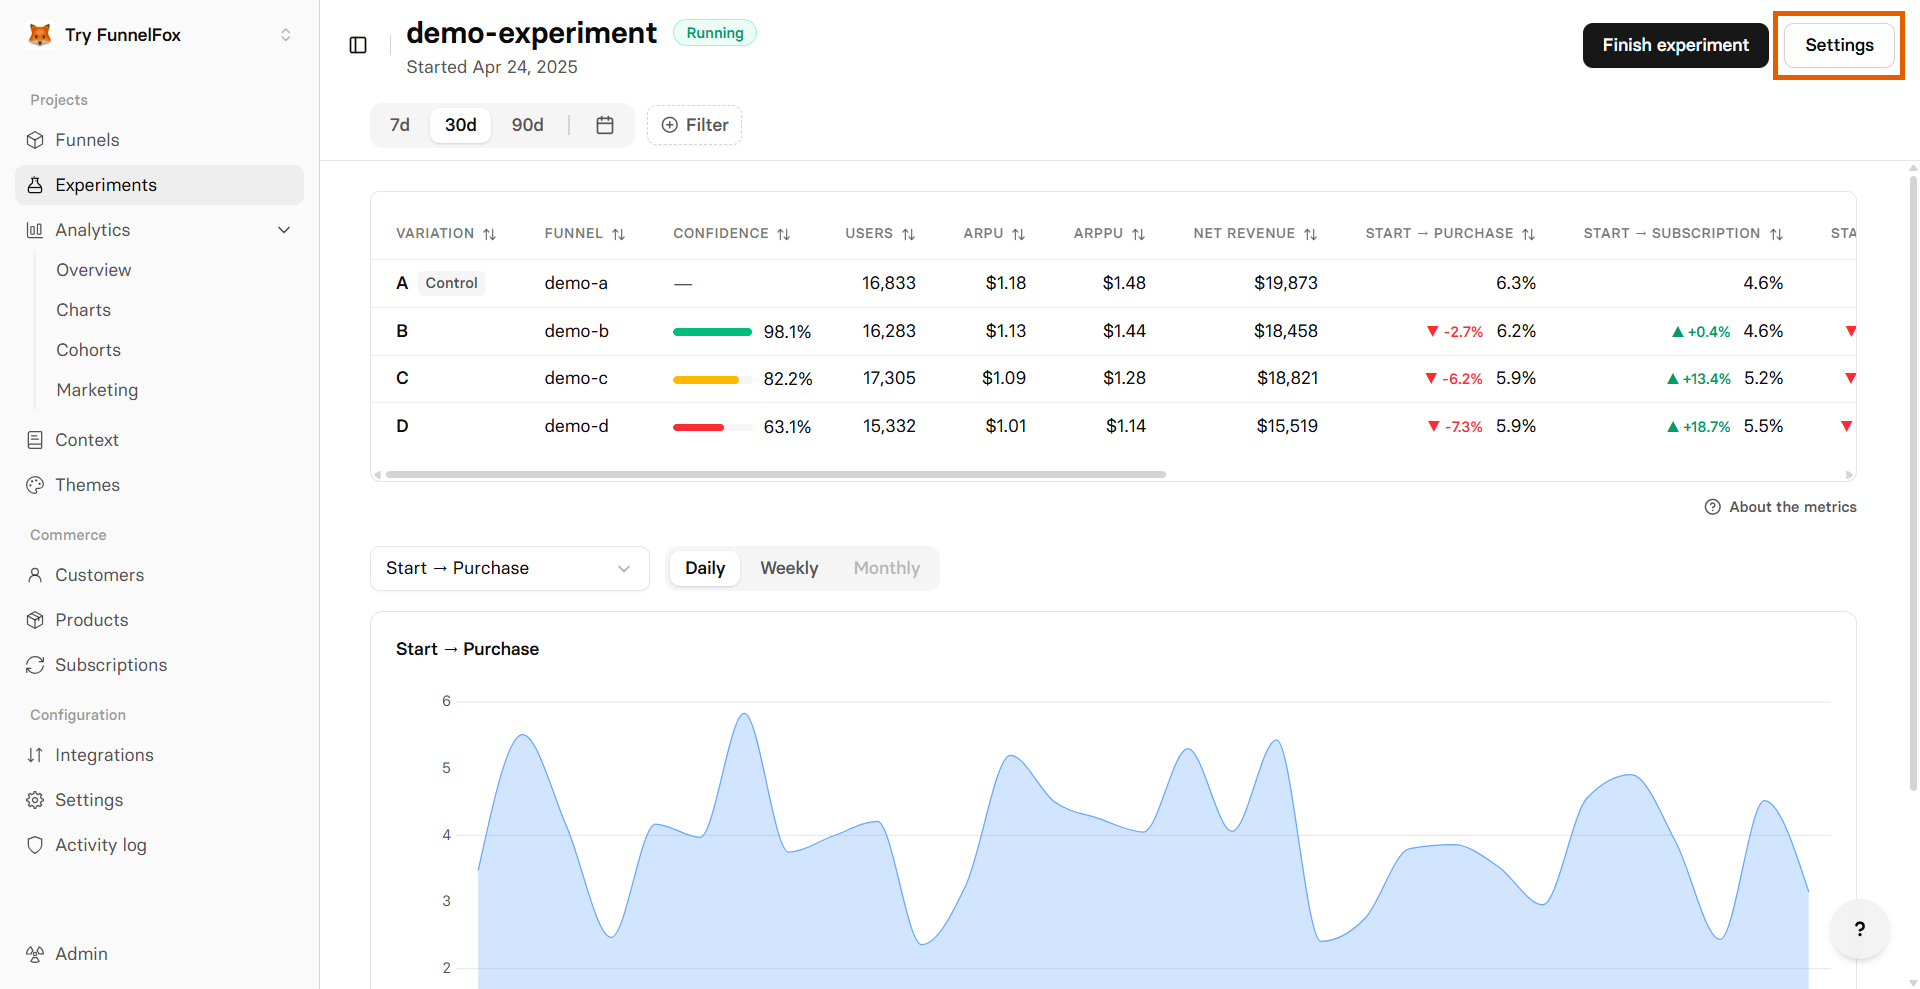
- Name
- Alias
- Variants
- Traffic split
Swapping a variant’s funnel changes which funnel’s data is shown in that row, but no historical data is deleted. Events stay tied to the experiment, so re-adding a removed funnel brings its data back.
You can’t archive a funnel while it’s part of an active experiment. Finish the experiment first.
Experiment event metadata
FunnelFox attaches experiment context to every webhook event, nested under thelocation object. Look for these fields:
experiment_id— unique identifier for the experiment.experiment_title— human-readable experiment name.experiment_alias— the URL alias the experiment runs on.
experiment event property (Amplitude, Mixpanel). The experiment alias is available via webhooks (experiment_alias), not through CDP event properties.