How experiments work
When a user visits the experiment URL, FunnelFox assigns them to a variant. Every session, purchase, and event is recorded with the experiment context attached. This lets FunnelFox compute per-variant conversion rates, ARPU, and statistical metrics so you can see which funnel actually performs better. The first variant in your experiment is always the control — the baseline everything else is measured against. All other variants are compared to it using statistical significance.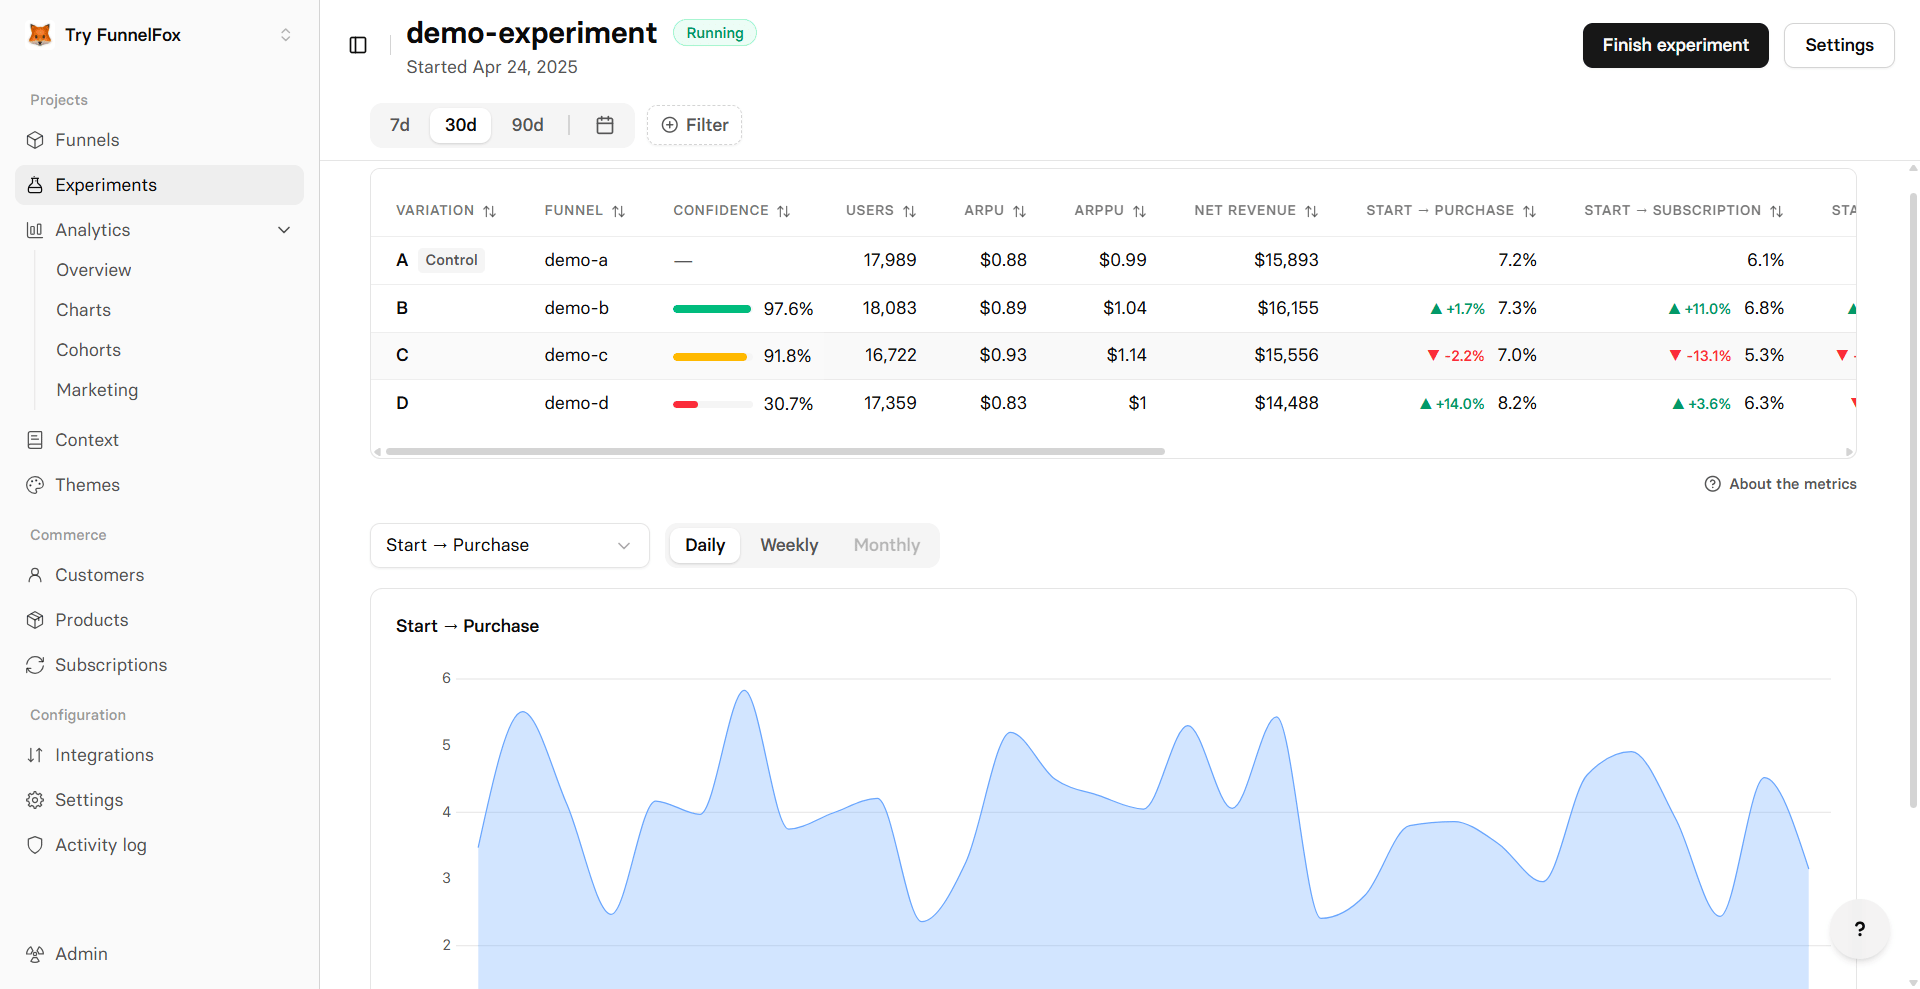
Experiments page
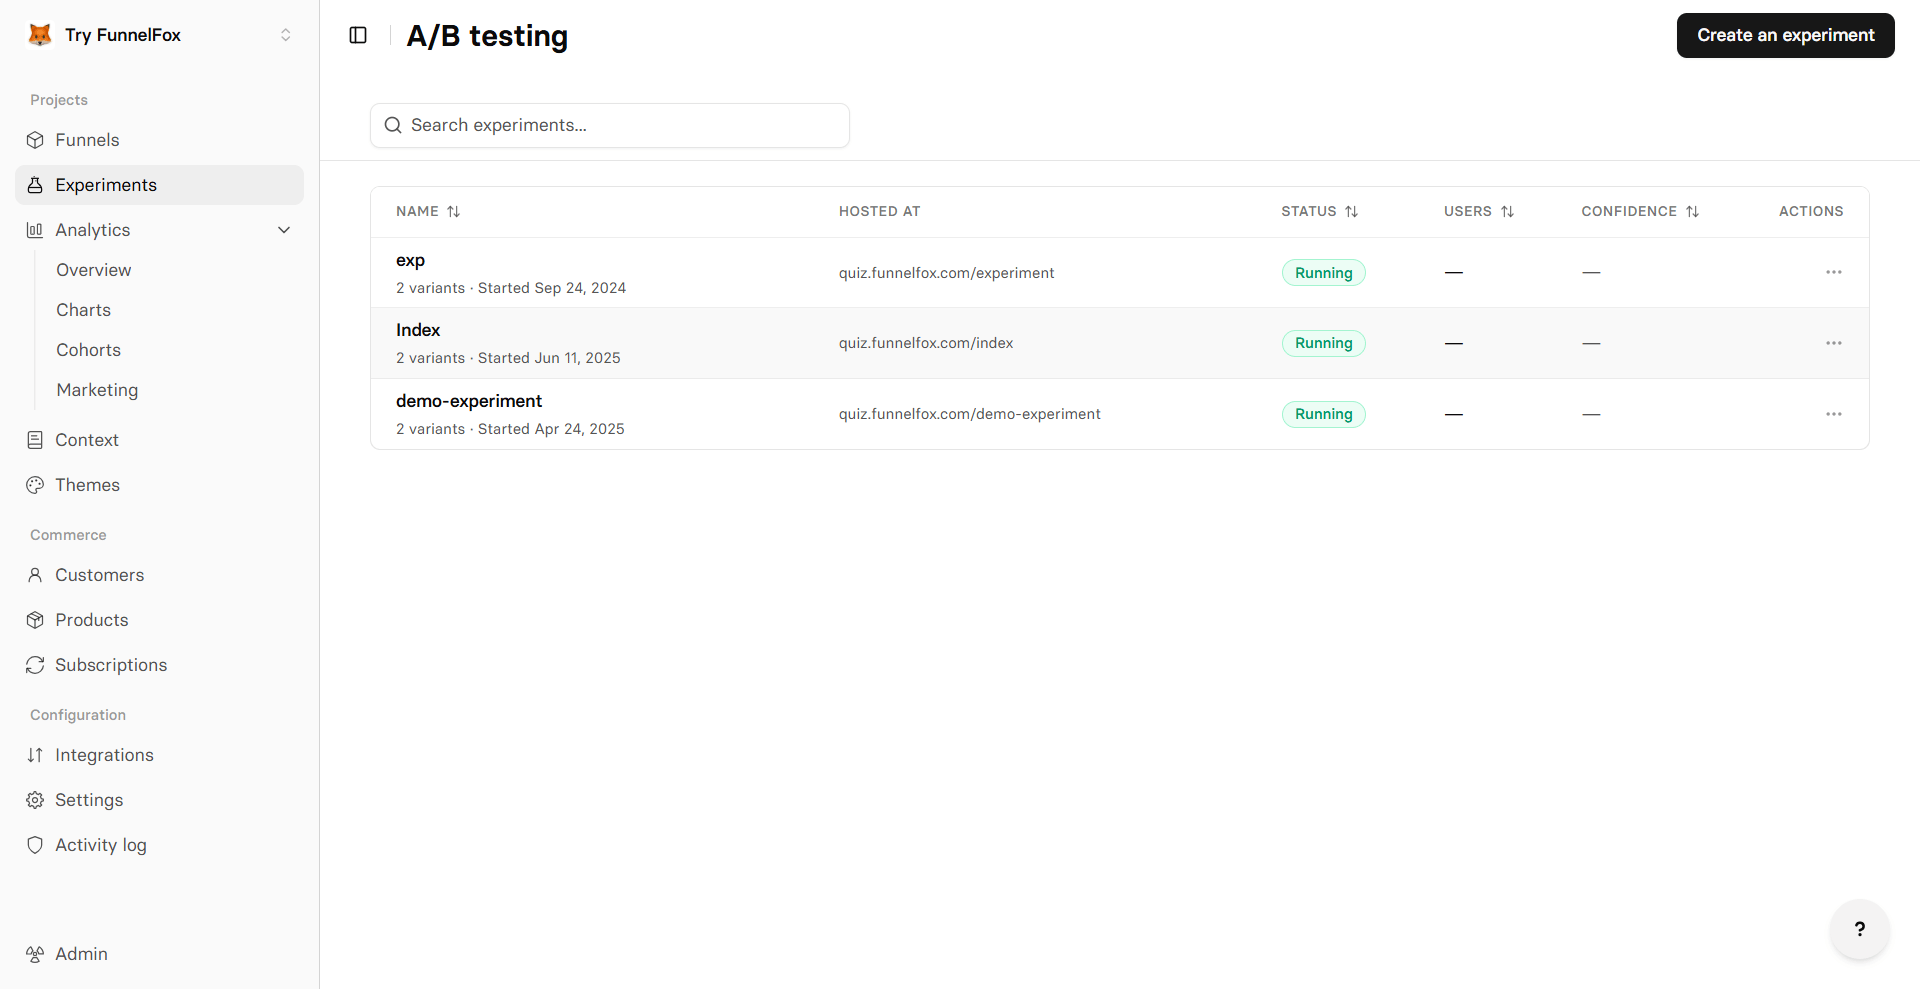
The Experiments page in the dashboard is where you manage all your tests. From there you can:- View all your experiments and their status: Draft, Running, or Completed
- Create a new experiment
- Finish a running experiment, or re-enable a finished one
- Open the analytics overview for any experiment
Get started
Ready to run your first test? The next guide walks you through creating an experiment step by step.Create an experiment
Set up your first A/B test — choose funnels, configure traffic split, and launch.