
Read your market
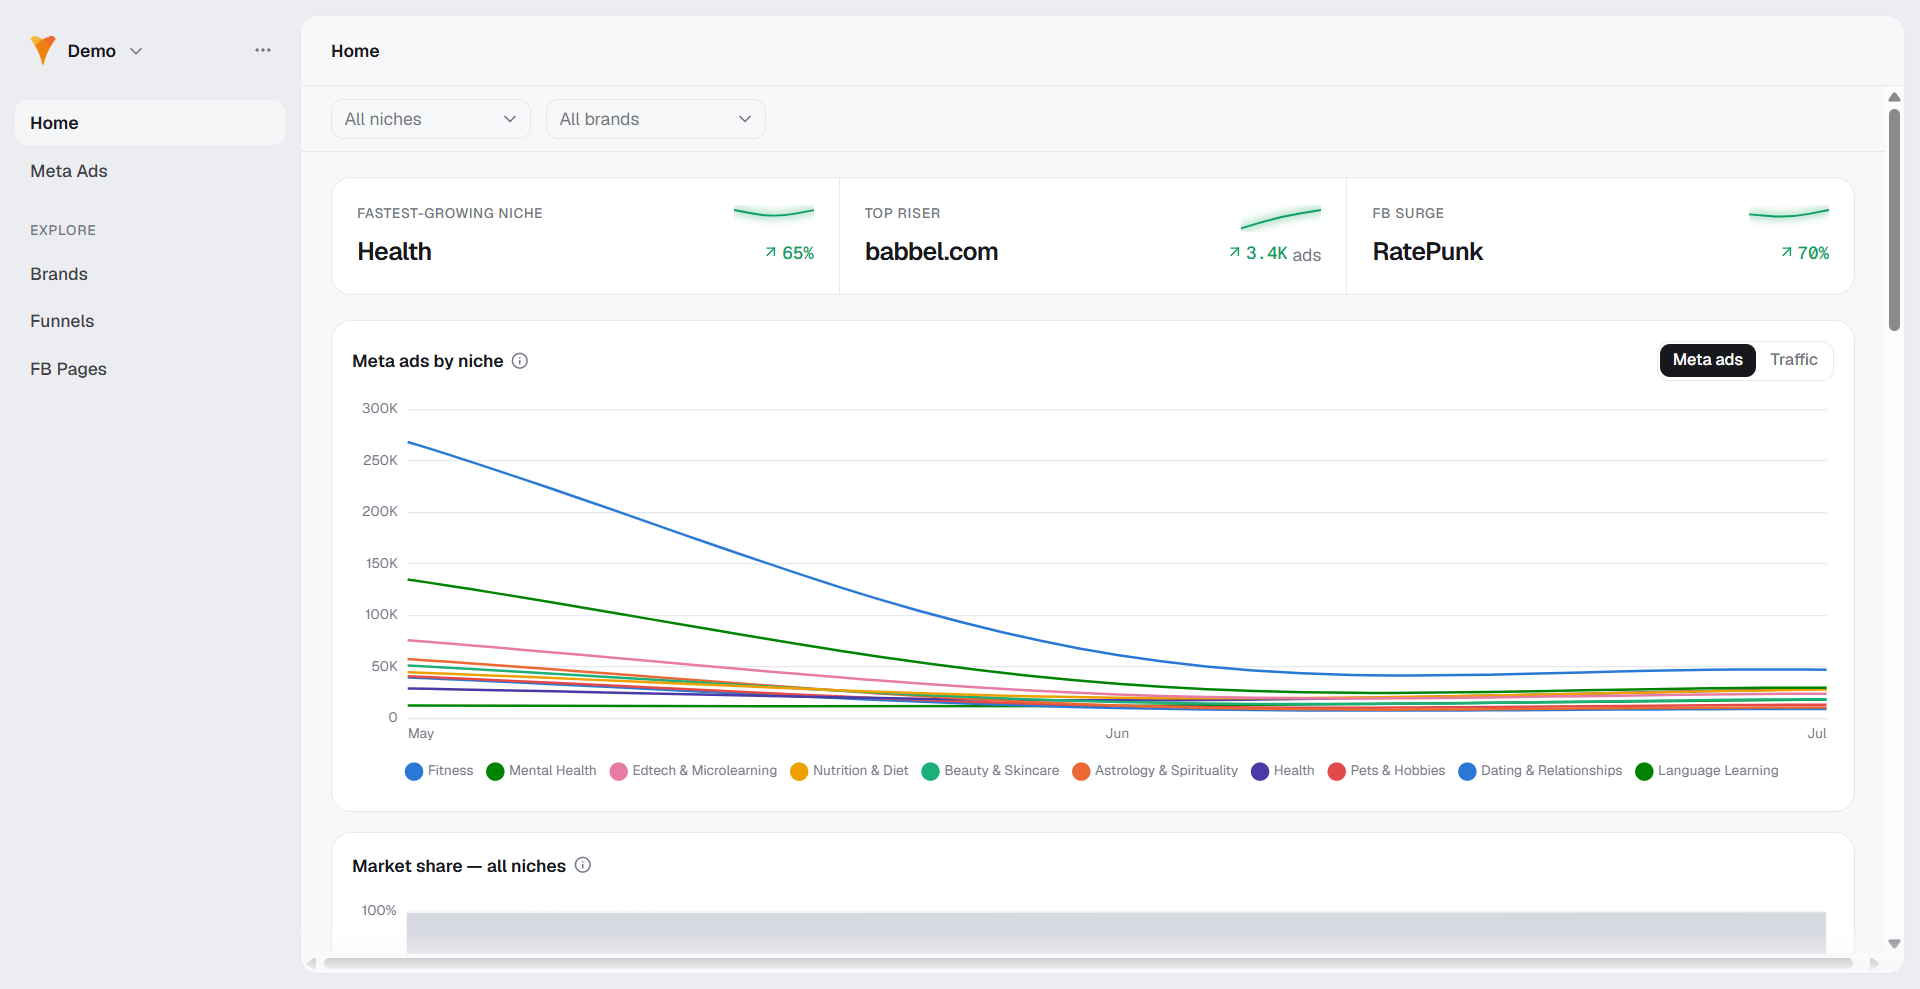
See how much your category advertises each month, and which niches
are growing or shrinking.
Track competitors
Find who advertises in your niches, how much, and who is rising or
falling.
Follow their funnels
See the landing funnels and Facebook pages behind a brand’s ads, and
the languages they run in.
Study their creatives
Browse the ad creatives and captured paywalls running in the market.
How Market Radar works
Market Radar measures market activity as Meta ads amount: the number of active Meta (Facebook) ads observed per month. Every chart and table across Market Radar is built on this count.Meta ads amount is a count of ads, not spend, conversions, or revenue.
Use it to gauge how much a brand, funnel, or page is advertising, not
how much it earns.
How to read Market Radar
Market Radar’s sidebar has two parts. Home and Meta Ads sit at the top: Home is the market overview, and Meta Ads is the creative gallery. Below them, the Explore group holds Brands, Funnels, and FB Pages, one list per entity type. Every row in a list opens a detail page, and detail pages link to each other. A brand links to its funnels and Facebook pages, a funnel links back to its brand and to the pages advertising it, and an ad links to its page, its brand, and the funnel it points to.In Market Radar, “brands” and “funnels” are competitors’ assets that
Market Radar discovered in the market. They are not your own FunnelFox
funnels.
Get started with Market Radar
Explore market
Read the market overview, then dig into individual brands, funnels,
and Facebook pages.
Meta Ads
Browse and filter the actual ad creatives running in the market.
Metrics & data
Understand what the numbers mean, including how growth is measured.
Next steps
- Explore the market
- Browse the Meta Ads gallery
- Learn how to read metrics and data