
Market overview
The Home page answers “what is happening in my ad market right now?” It combines headline insights with charts and tables that you can filter by niche and brand. When you select brands, the whole page compares just those brands (a watchlist view).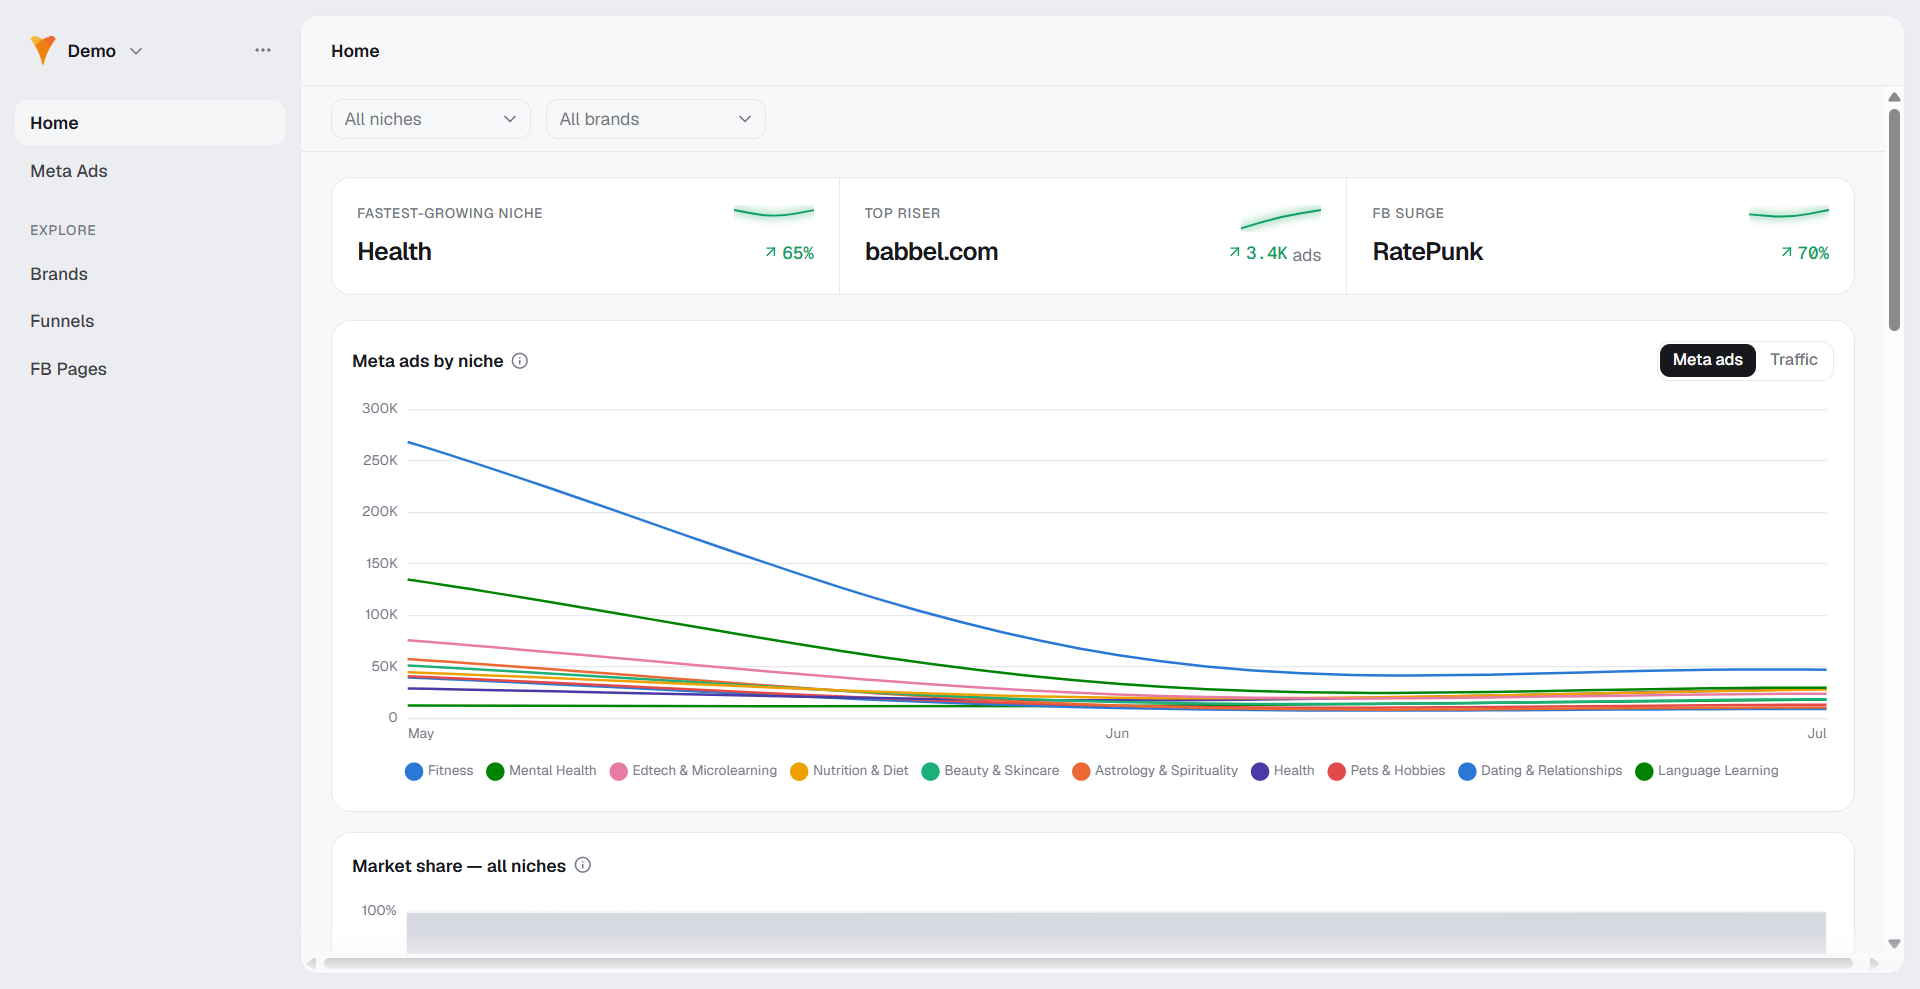
- Fastest-growing niche: The category with the highest growth.
- Top riser: The brand with the biggest increase in ad activity.
- FB surge: The Facebook page with the biggest jump in activity.
- Ad activity: A line chart with one line per niche (or per selected brand). Switch the measure between Meta ads and Traffic.
- Market share: A chart that stacks each brand’s share of ad activity to 100%. It shows the top eight brands plus an Others band.
- Category ranking: A sortable table of niches with brand counts, ad amounts, estimated web visits, growth, and a trend sparkline.
- Market movers: The 25 brands with the biggest change in ad activity between the recent and previous halves of the window. Filter by Rising or Falling. Rows are ranked by the size of the change, so no column header shows as sorted.
- New on the market: Brands, funnels, and Facebook pages that first appeared in the last three months.
Brands
The Brands list answers “which brands are active in my niches, how much are they advertising, and are they growing?” Each row shows the brand domain, its niche, per-month ad counts, the windowed Ads amount total, estimated monthly visits, growth, and a trend sparkline. The list sorts by Ads amount descending by default, and you can sort by brand, niche, ads amount, visits, or growth.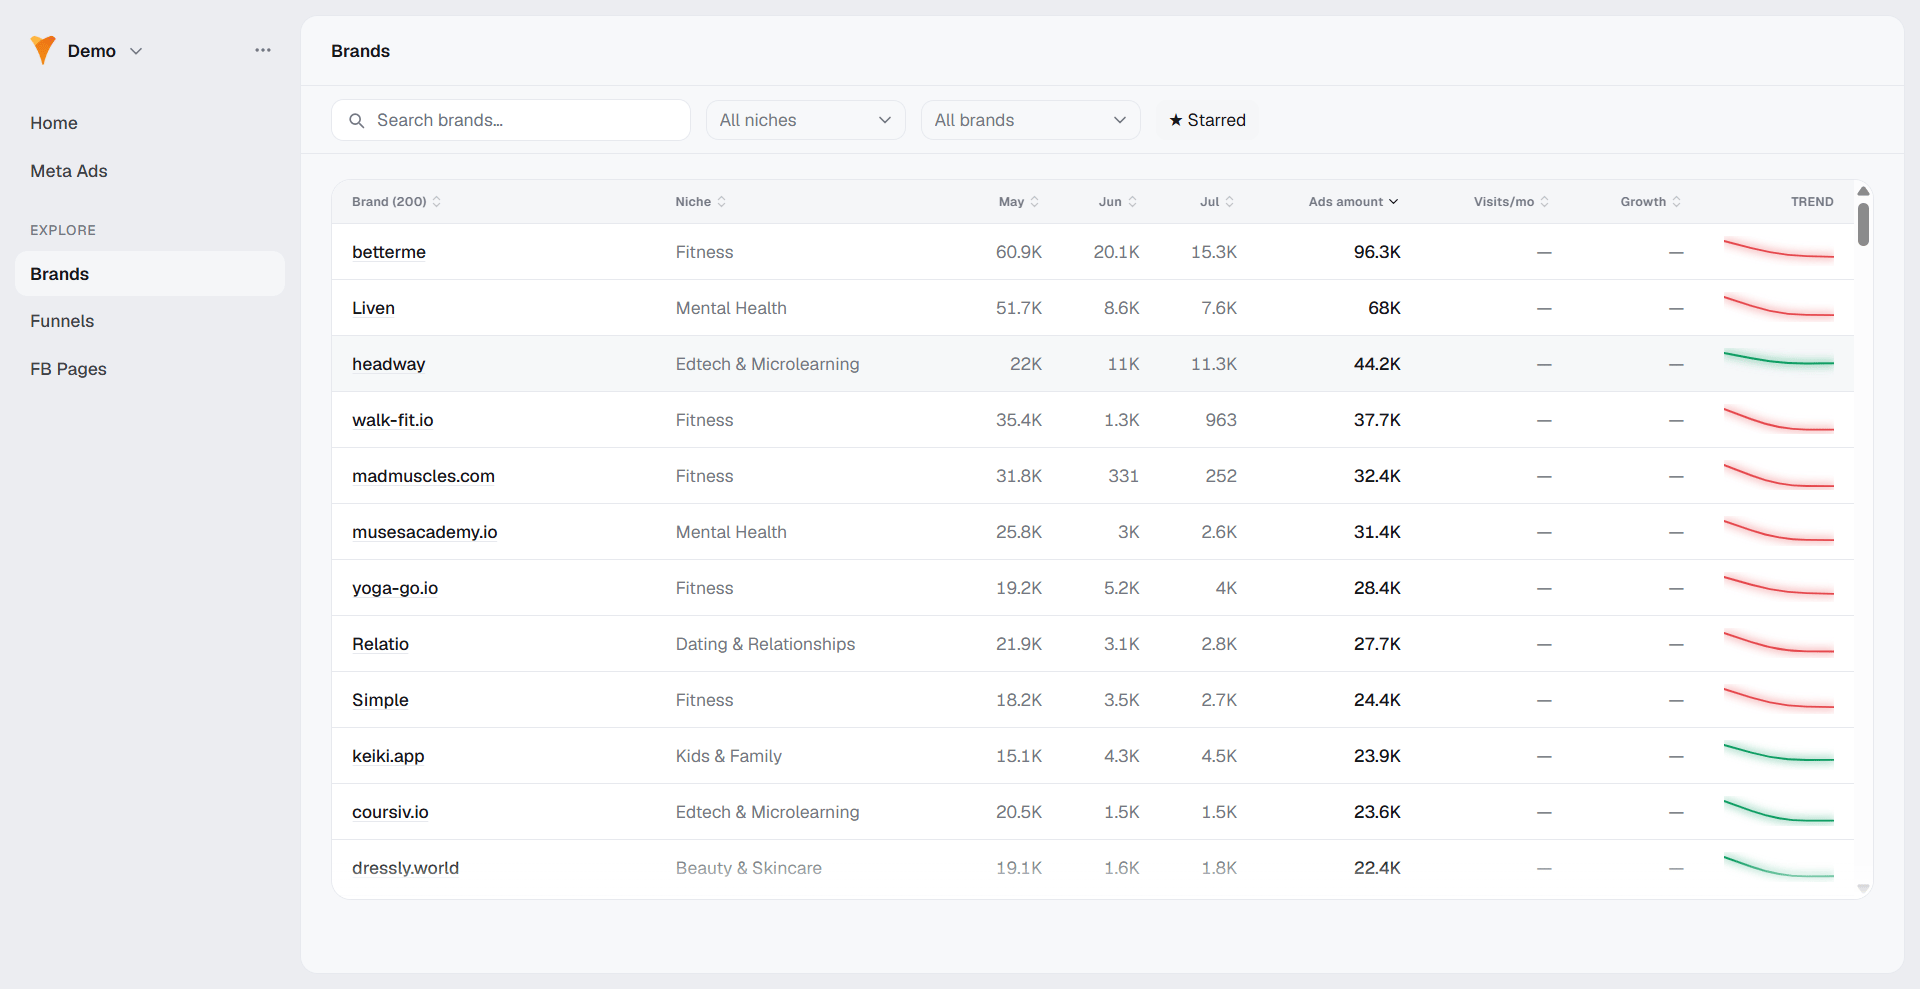
Brand detail
A brand page opens with the domain, an interactive favorite star, and a meta line showing the niche, the number of funnels, and when the brand was first seen.A brand’s funnel count depends on how it structures its URLs, so counts
are not comparable between brands.
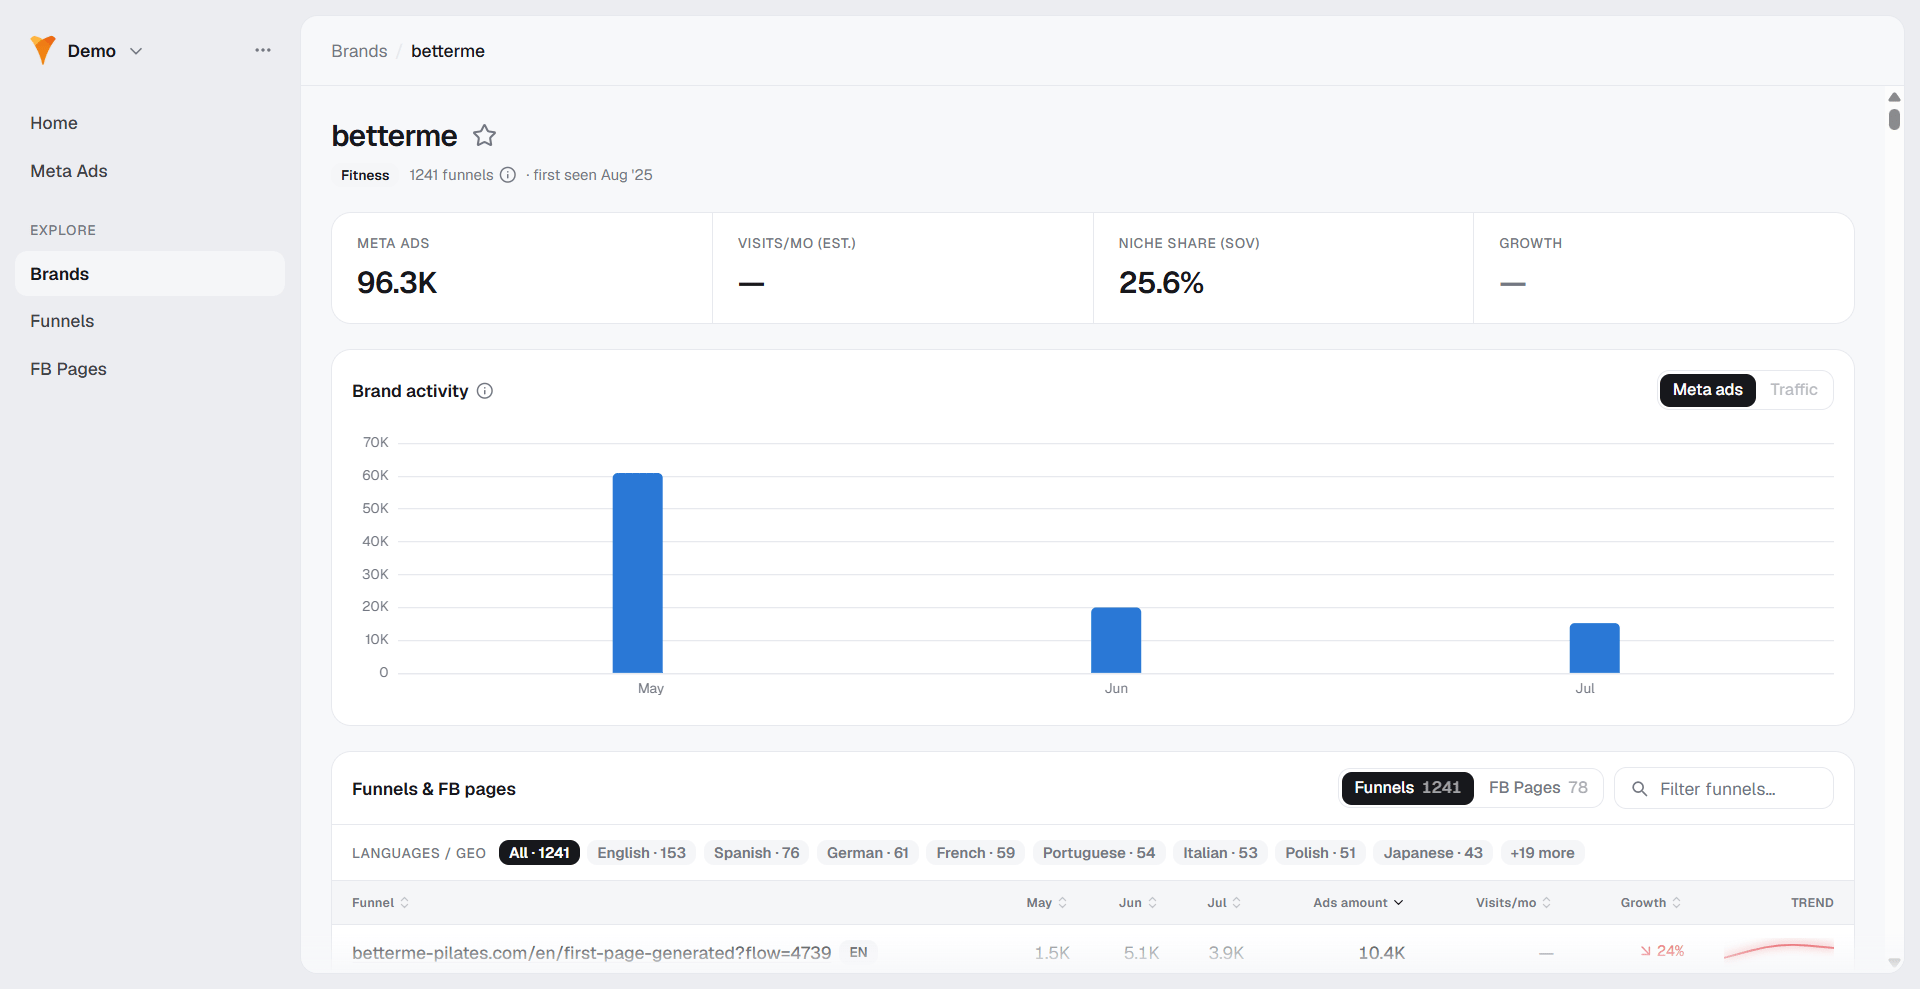
- Meta ads: The brand’s total ad activity across the window.
- Visits/mo (est.): Estimated monthly web visits.
- Niche share (SoV): The brand’s share of its category’s ad activity.
- Growth: How the brand’s estimated web visits changed across the window. Learn how growth is measured.
- Funnels: The brand’s landing funnels, with a languages and geo chip row, per-month activity, ads amount, estimated visits, and growth. A Dynamic entry badge flags a funnel that routes most of the brand’s ads through one URL.
- FB Pages: The Facebook pages running the brand’s ads, each with a link to the page detail and to its Facebook Ad Library.
Growth in both panels measures ad counts, not the web visits behind
the brand’s own Growth tile. A funnel’s Visits/mo is
apportioned from its brand’s traffic rather than measured for that
funnel.
Web visits
Market Radar shows estimated web traffic for brands, drawn from SimilarWeb. Visits appear as the Visits/mo (est.) KPI and a Visits/mo column, and as a series when you switch an activity chart to Traffic.Traffic is an estimate, so it always carries a
~ or an “(est.)”
label. When a brand has no current traffic data, Market Radar shows no figure
rather than a stale one, and the Traffic chart toggle is disabled.
See Visits/mo for how it is
measured.Funnels
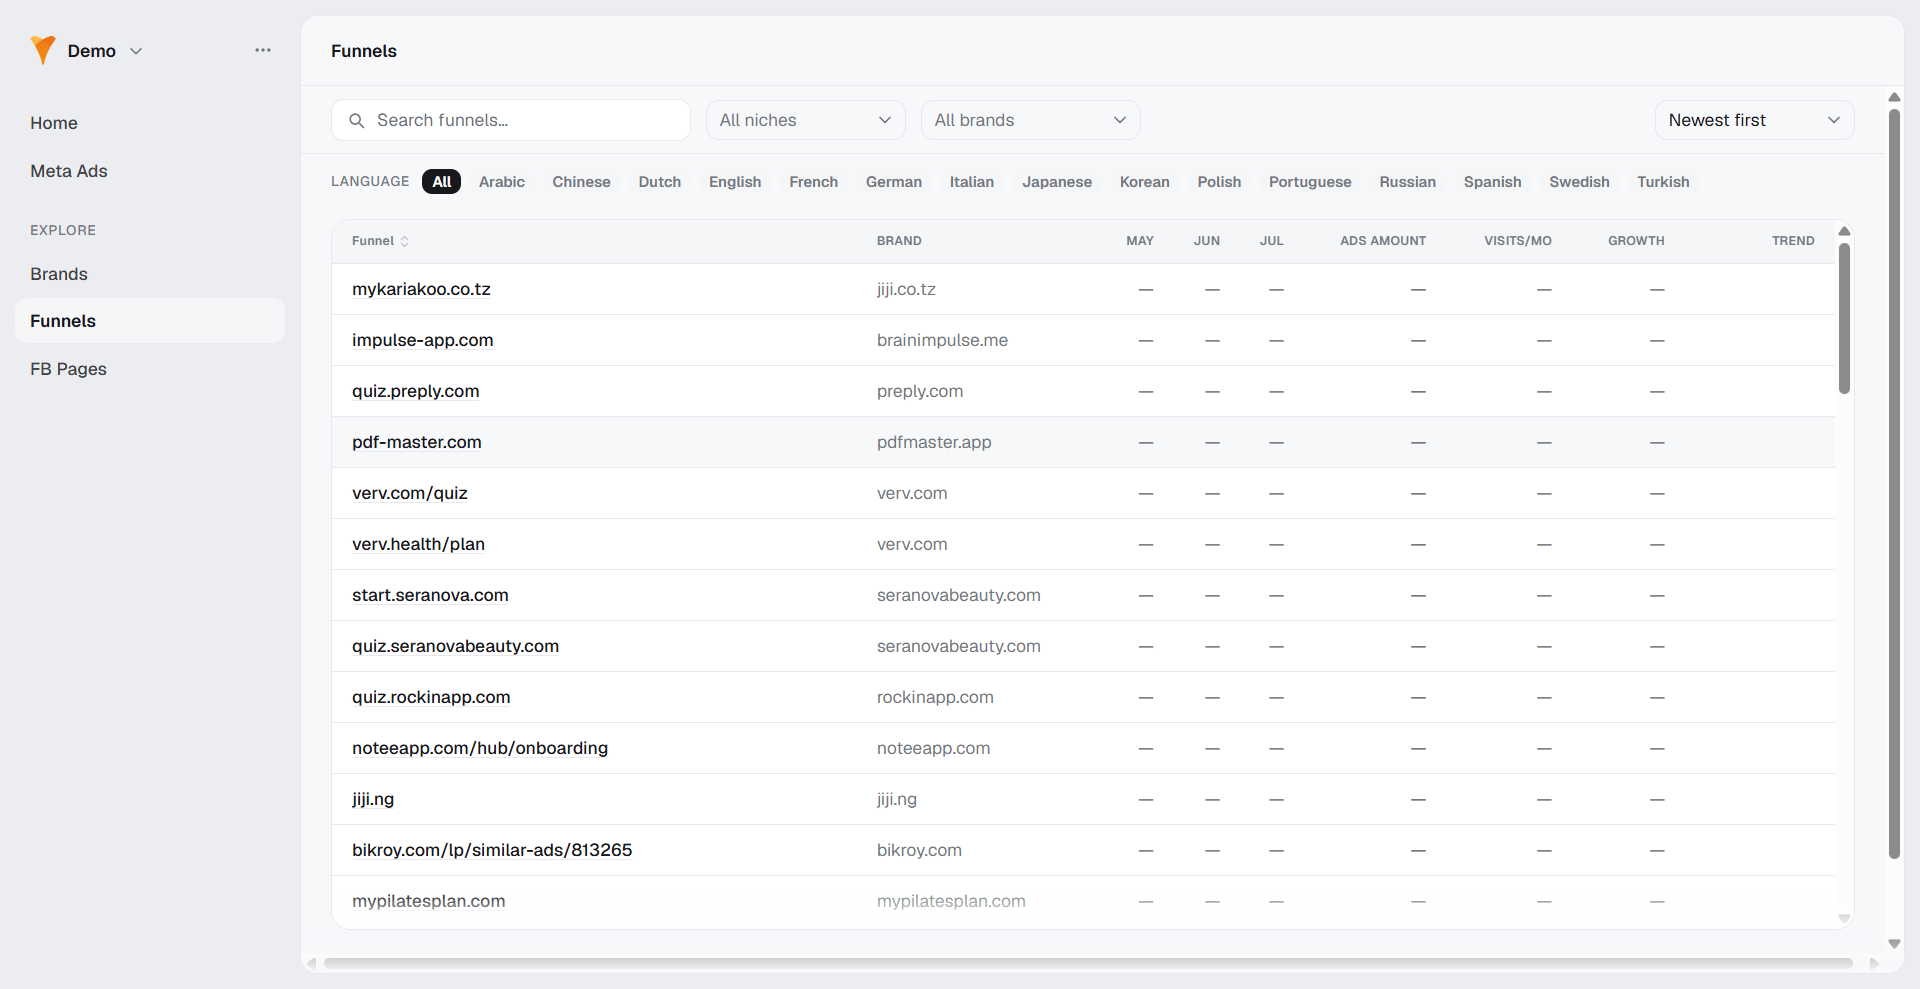
The Funnels list answers “what landing funnels run across the market, in which languages, and how active are they?” Filter by search, niche, and brand, toggle languages with the language chip row, and sort by Newest first, Oldest first, or Recently active. Each row shows the funnel label, its brand, per-month activity, ads amount, estimated visits, growth, and a trend sparkline. A Dynamic entry badge marks funnels that dominate a brand’s ad volume. Use Load more funnels to page through the list.Search matches only the funnels already loaded, and Load more
funnels is hidden while you search. If a funnel you expect is
missing, clear the search and load more rows first.
Funnel detail
A funnel page opens with its label, a Dynamic entry badge when relevant, and a meta line linking to the brand, the language, an Open funnel link, the funnel id, and the first-to-last-seen range. The KPI strip shows Meta ads, Visits/mo (est.), Growth, and Creatives (the number of attributed ads). Below it:- Leads to: The destination URL as an external link.
- Advertised by: The Facebook pages whose ads drive this funnel, with each page’s ad amount.
- Paywall: The funnel’s captured pricing (see below).
- Creatives: A grid of ad cards, with a link to open the full gallery filtered to this funnel.
Paywall
The funnel page paywall section shows what a funnel’s checkout looked like when Market Radar captured it:- Prices: The captured plan names and prices.
- Payment providers: The providers on the checkout, shown as chips.
- Screenshot: A thumbnail that opens a full-screen view.
- Captured: The month the snapshot was taken.
Paywall capture is being rolled out, so many funnels do not have one
yet. A funnel without a capture shows “No paywall captured for this
funnel yet.”
Facebook pages
The Facebook Pages list answers “which Facebook advertiser pages are most active, and which are ramping up or down?” Filter by search, niche, brand, and the Starred toggle. Each row shows the page name, its brand, per-month activity, ads amount, growth, a trend sparkline, and a link to the page’s Facebook Ad Library. The list sorts by Ads amount descending by default, and you can sort by page, brand, ads amount, or growth.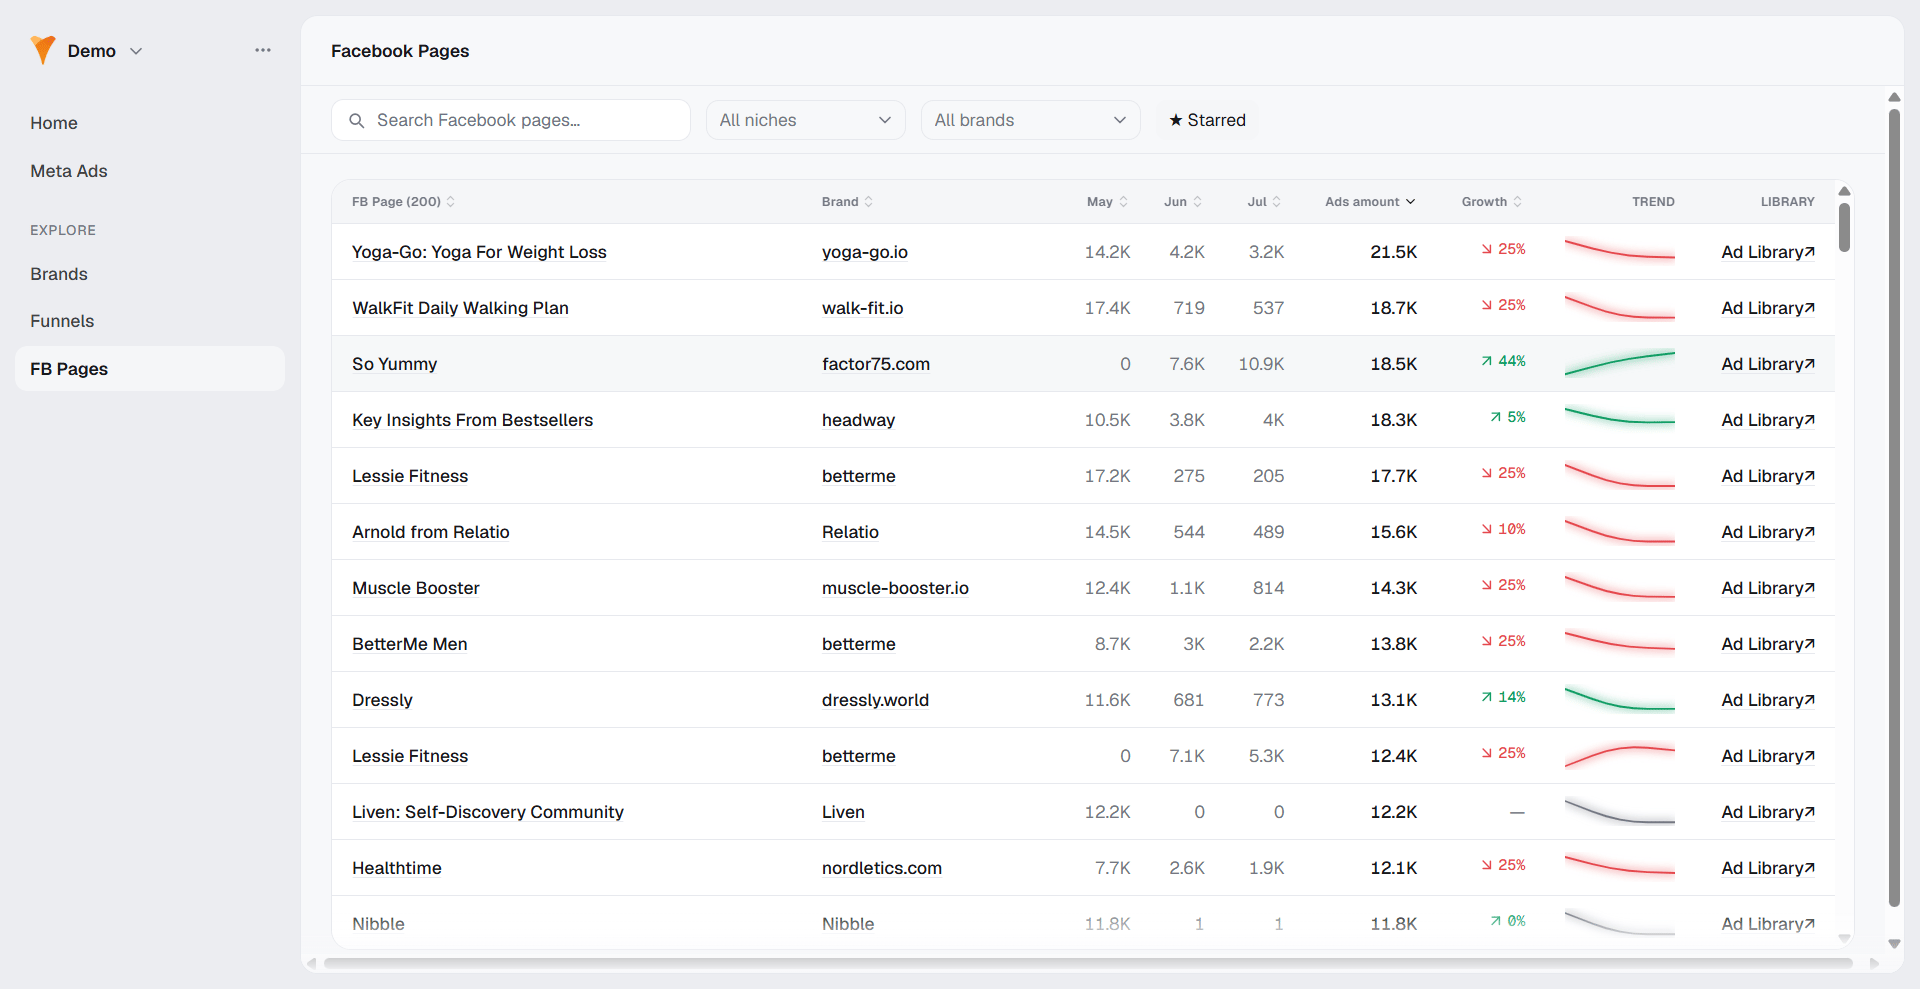
Facebook page detail
A page opens with its name, an interactive favorite star, and a meta line linking to the brand, the Facebook Ad Library, and the page id. The KPI strip shows Meta ads, Growth, Creatives, and First seen. Below it:- Ad activity: A bar chart of the page’s monthly activity.
- Leads to: The destinations this page’s ads link to, each with an ad amount. A destination links to a tracked funnel when Market Radar has one.
- Creatives: A grid of the page’s ad cards.
Facebook page data is added as
run, so a page can show no monthly activity or an empty creatives grid
until its data arrives. A page’s Growth also covers a different
span than the rest of Market Radar: the last three months against the previous
three.
Next steps
- Browse the Meta Ads gallery
- Learn how growth and estimates work in metrics and data