State of Web2App 2026
Funnels, payments, and LTV benchmarks across five global regions — parsed from public data, anonymized revenue, and the apps actually shipping today.
10 data points that define Web2App in 2026
The State of Web2App 2026 report, published January 2026 by FunnelFox, analyzes Web2App funnel performance across 8 App Store categories and 5 global regions (US, Europe, LATAM, APAC, MEA), drawing on Meta Ads Library parsing, Web Funnels Club intelligence, and anonymized FunnelFox platform data.
-
82% of top-grossing apps use Web2App in 2025
Up from roughly 46% in 2024 — nearly doubling year over year. Web2App is now the default acquisition path for leading subscription apps.
Source: Meta Ads Library + Web Funnels Club, 2025. -
+77% YoY growth in Web2App adoption
Indexed adoption rose from 20 (2023) to 35 (2024) to 62 (2025), accelerating as teams shift acquisition to the web for control and iteration speed.
Source: Meta Ads Library Parsing, 2023–2025. -
~176% revenue growth for funnel scalers
Brands that actively scale Web2App funnels — running multiple intent-driven funnels in parallel — see ~176% YoY revenue growth versus single-funnel peers.
Source: FunnelFox aggregated platform data, 2025. -
90% of scaler revenue comes from web funnels
Among funnel scalers, only ~10% of subscription revenue still flows through in-app funnels. Web is now the dominant monetization surface.
Source: FunnelFox aggregated platform data, 2025. -
Health & Fitness leads with ~196 high-volume funnels
Health & Fitness operates roughly 5× more high-volume Web2App funnels (>100 creatives/month) than the next category, driven by Fitness, Mental Health and Nutrition sub-verticals.
Source: Meta Ads Library + FunnelFox, 2025. -
Finance & Career projected at ~70% growth in 2025
Finance & Career outpaces every other category. AI Tools, Language Learning and Astrology form the next tier (12–22%); most categories cluster in single-digit growth.
Source: FunnelFox category projections, 2025. -
The biggest drop happens before the paywall
Most Web2App funnels lose more users in the quiz / onboarding phase than at checkout. Pre-paywall optimization yields the largest CR lifts.
Source: FunnelFox conversion analytics, 2025. -
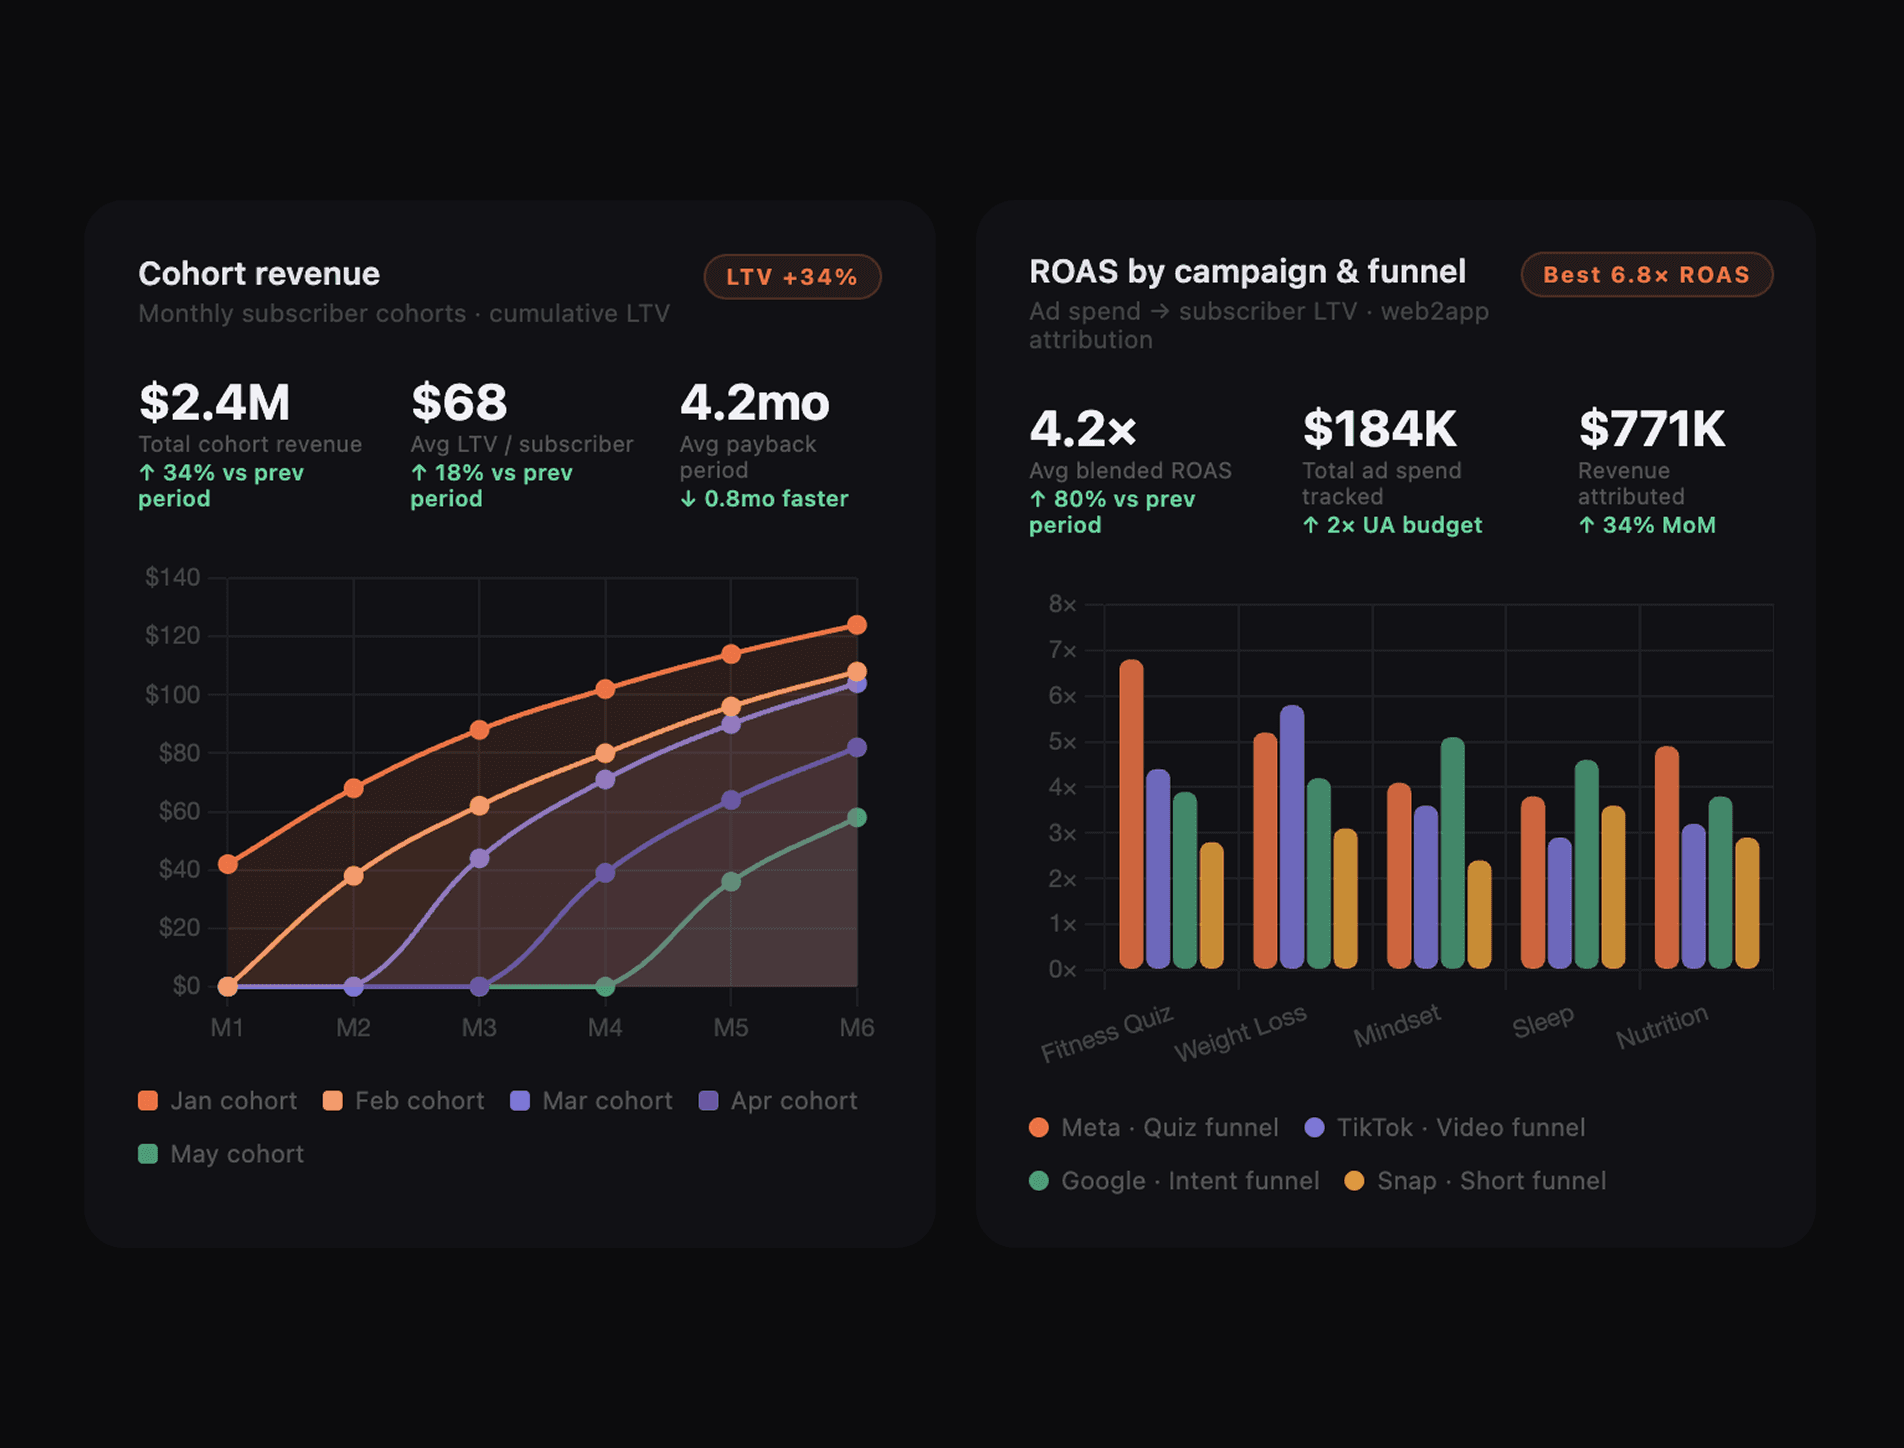
Web LTV outperforms in-app LTV across plan durations
Annual plans lock in revenue at month 1 (~$69 LTV); blended median LTV reaches ~$67 by month 12 on web vs. lower paths in-app due to store commissions and weaker pricing flexibility.
Source: FunnelFox cohort analysis, 2025. -
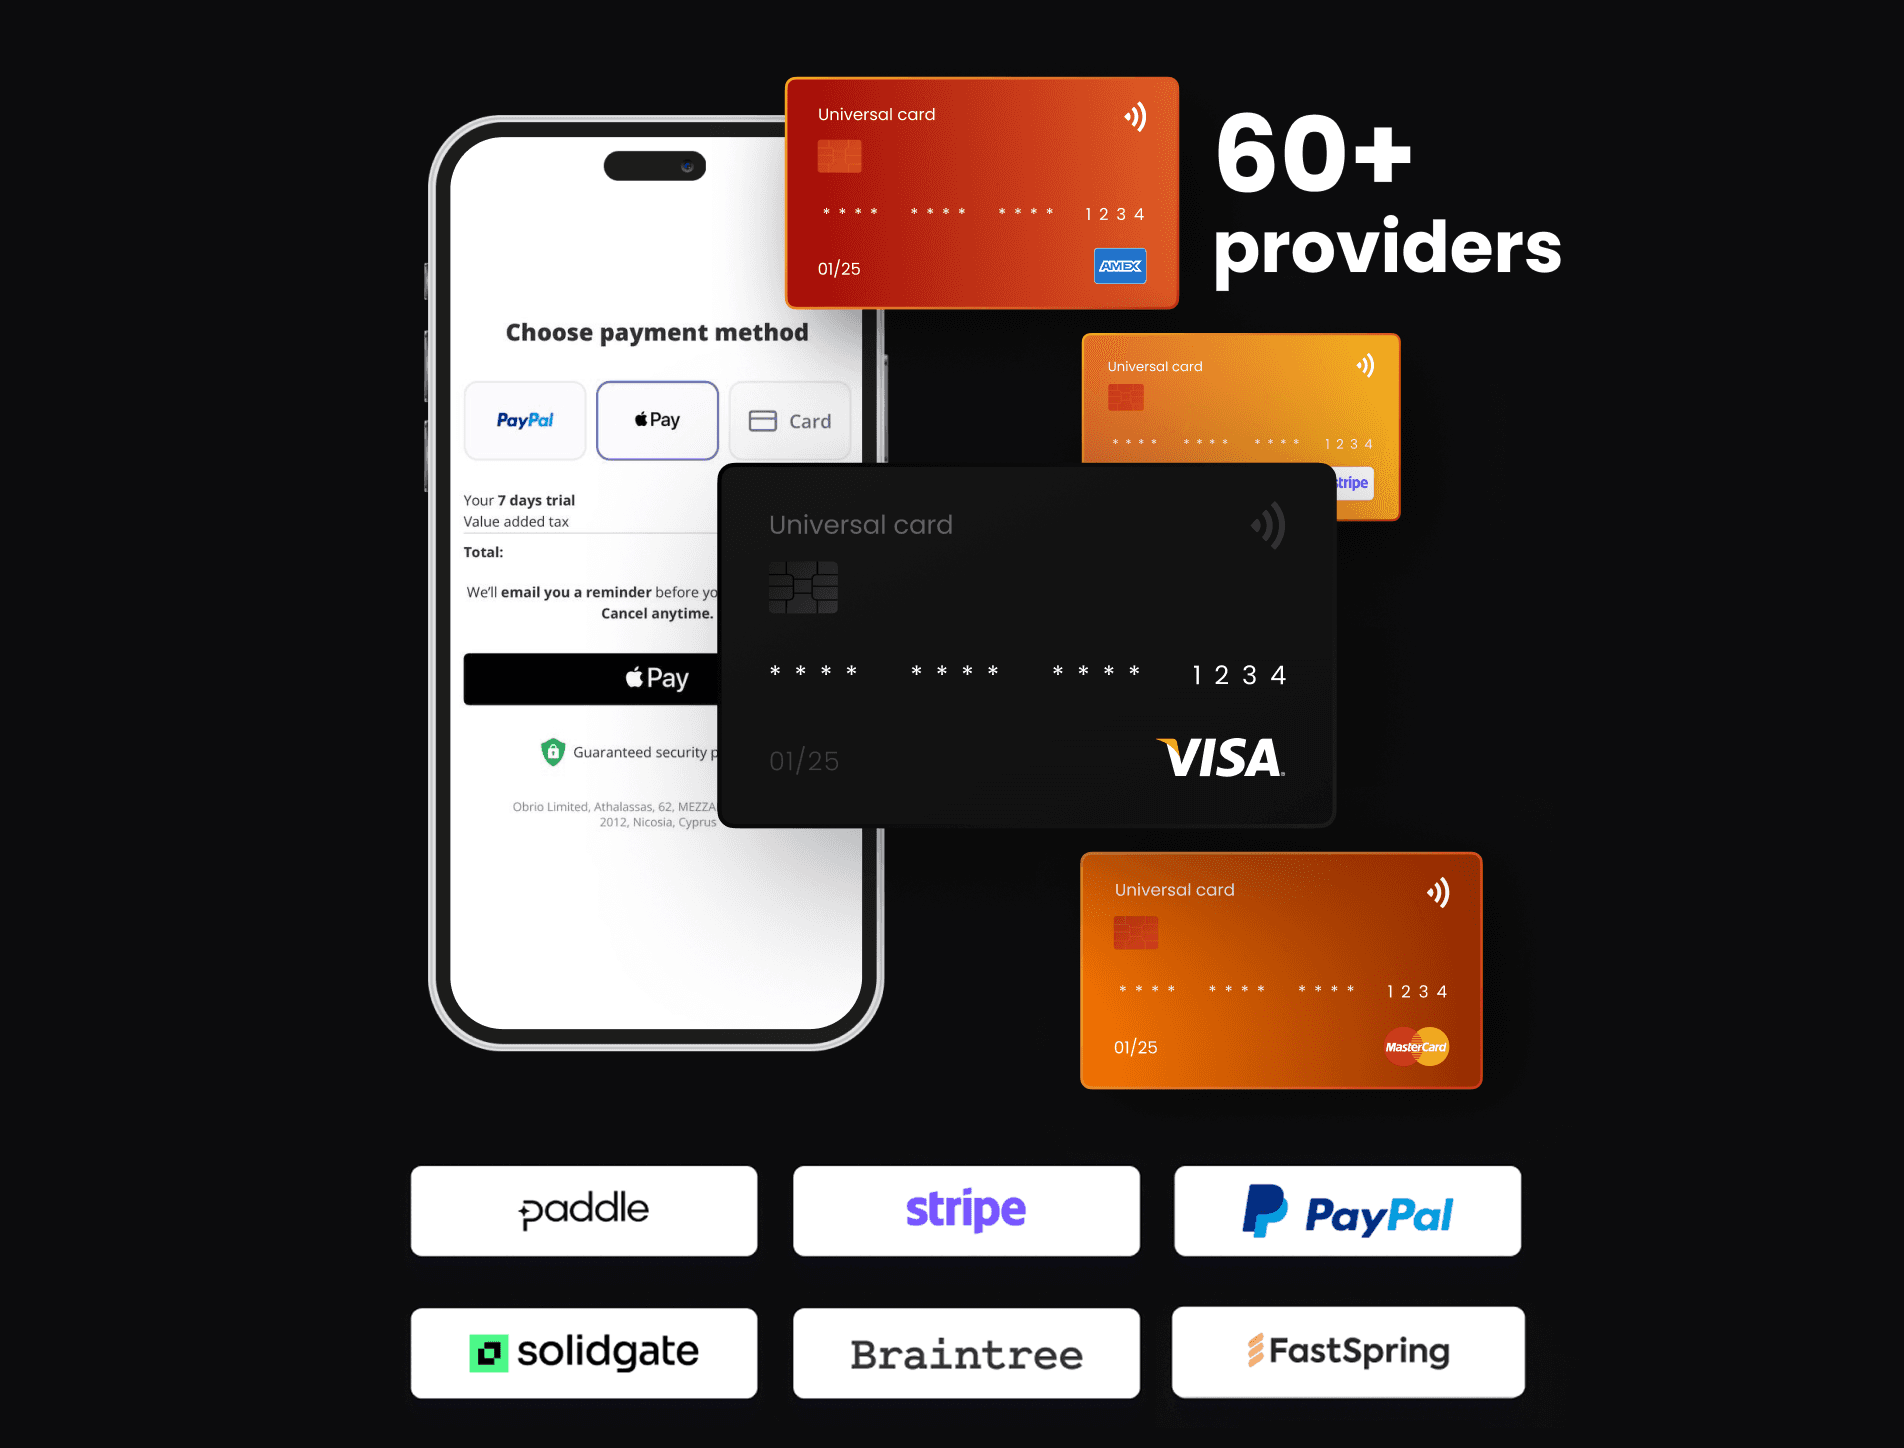
Payment infrastructure is now a growth lever
Apps with multi-PSP routing, local payment methods (Apple Pay, Google Pay, regional rails), and intelligent retry logic see materially higher authorization and net revenue.
Source: FunnelFox Billing aggregated data, 2025.
The first global, data-backed view of how leading subscription apps build, price, and scale on the web.
Aggregated parsing of global web funnels, Meta Ads Library, and third-party ad intelligence.
Apps with active Web2App funnels meeting minimum traffic & revenue thresholds, and apps using FunnelFox for funnel management and web payments.
Health & Fitness, EdTech, Utilities, Photo & Video, Lifestyle, Social, Finance & Career, Productivity.
United States, Europe, Latin America (LATAM), Asia Pacific (APAC), Middle East & Africa (MEA).
All data was processed in batches with added randomization. No individual user, account or session data is identifiable in any chart in this report.
Coverage across five regions
Pricing, funnels, conversion, LTV and payments — sliced consistently for the regions that matter most for subscription growth.
- North America (US + Canada)
- Europe
- Asia-Pacific
- Latin America
- Middle East & Africa
Web2App is now the default growth engine
for top-grossing apps.
To understand what the fastest-growing teams do differently, we analyzed the patterns behind top-performing apps. This report breaks down what we found: how leading apps approach pricing, refunds, payments, churn, and LTV; how funnels differ by market; and which tactics consistently deliver results.
If you’re looking to scale acquisition with more speed, clarity, and control, these insights are a great place to start.
Teams are shifting acquisition to the web to enable faster iteration and greater control over the funnel.
High-performing apps adopt web2app for faster iteration, better attribution, and stronger revenue control.
When scaling starts, funnels account for ~90% of total revenue. In-app falls to a long-tail channel.
The number of creatives increased significantly in Q3, likely due to the Andromeda launch. The largest companies accounted for the majority of this increase — followed by a sharp Q4 pullback across all tiers.
Funnels producing more than 100 creatives per month, by App Store category. Health & Fitness sits at ~200 funnels — roughly 5× the next category.
Across the space, we’re seeing teams break their growth strategy into highly specific funnels for distinct intents — whether it’s a calisthenics workout, walking, yoga, or Tai Chi — with a direct link to creatives. When you segment by user motivation, you match messaging to mindset before install, and that drives stronger conversion and retention than broad, one-size-fits-all paths.
Health & fitness apps benefit from this approach because their audiences are defined by goals and habits, not passive discovery. As a result, Web2App adoption in this category isn’t a fad — it’s reflective of deeper user behavior: people come to these apps because they want results, and funnels that speak directly to that intent unlock more efficient monetization and clearer signals for optimization.
- Within Health & Fitness, funnels split into five distinct sub-segments.
- Leading apps run multiple funnel types simultaneously to target different user intents and narratives.
- More specific, niche funnels tend to outperform broad, generic ones.
- Finance & Career outpaces every other category, projected at ~70% growth.
- AI Tools, Language Learning and Astrology form the next tier (12–22%).
- Most categories cluster in single-digit growth — the spread is steep.
It severely limits any kind of network effects and word of mouth. You’re cutting yourself off from younger demographics who prefer app-native experiences and distrust web payments. The result is a model that pushes short-term ROAS but boxes you in: premium store search traffic won’t become available, and you never build the freemium flywheel that compounds over time — making you dependent on paid acquisition.
Your type of product, growth stage and competitive landscape should determine if your current focus is web or app. Grand scheme it’s not an either-or decision. Building a sustainable scaled consumer subscription business means leveraging both web-first and app-first flows for what they’re good at.
Top-quartile companies spread widely across high funnel counts — with a long tail extending past 200–300 funnels. Bottom-quartile companies cluster between 5 and 40. The number of active funnels is one of the strongest correlates with revenue tier.
With Web2App, those creatives don’t just change messaging — they land users into different funnels built for each intent. That’s what changes how teams scale: instead of optimizing one path for all traffic, you optimize many paths and let data show where to allocate more budget.
This level of intent-to-funnel matching would be impossible when buying traffic directly to the App Store. My advice is simple: think in clusters of intent, not single flows. When your creatives and funnel architecture reflect real user motivations, efficiency and ROI grow.
Six regions carry the remaining balance. European and APAC shares are rising but remain well behind North America on pure dollar volume.
- US — 63.7%
- Europe — 14.2%
- APAC — 7.7% · LATAM — 5.6%
- MEA — 4.6% · Canada — 4.2%
This shift isn’t just about reducing app store fees. It’s about restoring control and visibility. By moving parts of the monetization flow to the web, teams can connect acquisition, onboarding, and payments into a single, measurable journey.
In a post-ATT world, that level of clarity is essential for optimizing toward real revenue, not proxies. In the US especially — where spend, competition, and scale are highest — Web2App funnels and external payment links are quickly turning into a competitive advantage for teams that want to move faster, test pricing freely, and make every acquisition dollar accountable.
What the market data tells us about 2026
Web2app industry is growing — the number of funnels is up by ~77% YoY, with a consistent upward MoM trend.
Leaders launch multiple funnels to tap different high-performing segments.
Andromeda is amplifying the effect — Q3 growth in creatives and funnels is likely driven by Andromeda updates and optimizations.
Test many funnels to explore new segments. Experiment with a variety of ads and let Andromeda optimize winners faster.
Top-grossing apps don't send users straight to the store. They convert them on the web first.
- FunnelFox Agentic AI — build funnels at the speed of a prompt
- Launch profitable funnels in minutes, not weeks
- Improve ROAS with industry-proven templates
- Increase conversion rates and LTV with a seamless payment solution
- Experiment fast, launch improvements faster
- Collaborate with the team in one place
The biggest drop happens before the paywall.
Improving even one early step has a multiplied impact on revenue. The biggest wins come from reducing friction before the paywall, not after it.
With the same product and ad spend, funnel choice becomes a decisive growth factor.
- 01No app download — no friction at the start
- 02Deeper engagement through guided onboarding
- 03More flexibility in onboarding flow and paywall
- 04Stronger, more advanced monetization
- 05More payment method options
My advice is simple: build growth experiments around real user behavior, not assumptions. Align creative, tracking, and funnel logic so you’re constantly learning what drives conversion, retention, and long-term value. The web gives teams the freedom to test, iterate, and scale faster than ever.
Pricing is the fastest way to win or lose growth.
Weekly plans are a strong second at 30.5% — often indicating app categories with urgency or quick-consumption content.
Contrary to the “free trial always wins” narrative, direct-charge flows produce the majority of subscription revenue on the web.
In practice, that means breaking pricing experiments into clear buckets: entry offers that reduce friction, mid-tier options that maximize value perception, and premium tiers designed for your most engaged cohorts. You need to test these not just by price, but by timing, messaging, and cohort behavior. The funnel itself becomes your primary pricing lab.
My advice for Web2App teams: think of price as a conversion lever, not just a revenue lever. Experiment with localized pricing, dynamic offers based on intent signals, and bundling options that reflect real user priorities. The teams that figure that out early — and integrate pricing tests into their growth loops — consistently outperform competitors who treat price as a fixed variable rather than a strategic advantage.
The spread between weekly and yearly plans is almost perfectly linear — users aren't penalizing the channel, they're pricing it like any other subscription.
The Pricing Index compares the most popular subscription price in each country to the US baseline. The US is set at 1.00; values above mean pricier than the US, values below mean cheaper.
- Netherlands — 1.62 · ~62% more expensive than the US
- Turkey — 0.29 · nearly 3.5× cheaper than the US
- Use it to localize willingness-to-pay before launching in a new market
Shorter durations show wider variance; the 3-month plan is the most standardized and sits above the US baseline globally; the 1-year plan re-introduces wider dispersion in both directions.
Upsells don’t cause revenue growth on their own — they behave like LTV multipliers. Higher LTV is what unlocks scale on the acquisition side.
- Global median upsell price is around $9.31, varying by region and rising with subscription length.
- Users on longer, higher-value plans accept higher-priced upsells — 3-month subscribers generate the highest average upsell value.
Pricing isn’t a setting. It’s the product.
The most popular subscription is monthly, but the exact configuration should be a subject of experiment.
The higher the subscription tier a user buys, the higher-priced upsells they are willing to purchase.
Upsells don’t cause revenue growth by themselves but behave more like LTV multipliers — and higher LTV allows you to scale revenue.
Run a subscription plan experiment: test pricing, tier design, and billing cadence to identify the highest-LTV configuration. Maximize LTV via upsells — design them to deepen value for existing subscribers, especially higher-tier users. Personalize upsell pricing and offers — segment by subscription tier, usage, and behavior to align upsell price points with willingness to pay.
Web LTV outperforms app LTV — and changes the rules of scaling.
Session value is highly regional. Lower-value regions require tighter pricing and stronger funnel efficiency to stay profitable.
ARPPU clusters between $27–$31 globally. The real levers are getting users to convert — not what they spend once they do.
On web, the picture is different. Although auction prices and CPAs are higher there, the LTV is also significantly higher thanks to better subscription retention rates and the absence of app store fees. This improves net revenue per user and offsets the higher acquisition costs. In Health & Fitness projects, for example, app LTV typically sits around $40–45, while web LTV for the same product can reach $80–90.
CPAs should be aligned with these LTV differences to ensure sustainable unit economics. Evaluating performance without accounting for these structural differences can lead to misleading conclusions. Web and app should therefore be treated as separate economic models with distinct ceilings and scaling logic.
Box plots show the spread across funnels at each month of life. The box covers the 25th–75th percentile (median runs through the middle); whiskers reach the bottom and top of the observed range.
All plans
Blended median LTV path
1 week
Builds slowly, plateaus low
1 month
Steady linear growth
3 months
Stair-step at renewals
1 year
Locks in revenue at month 1
Though, keep in mind that it’s not a plug-and-play solution: expect time, budget, and experimentation to find the right funnel, offer and message.
Build a smart acquisition strategy with real-time LTV insights.
- Check subscription health, ARPU, ARPPU, LTV — all in one place
- Control everything that happens after the click
- Automate marketing tracking with Pixel and Conversion API
- Seamless integration: Meta, TikTok, Google, Pinterest, Twitter, Snap
- Mirror web funnels with top-performing ad visuals and messaging
Plan duration reshapes the retention curve.
Weekly
Steep decay · 100% → 3% by month 12
Monthly
Slower decay · 100% → 10% by month 12
Quarterly
Stair-step at renewal boundaries
That means designing onboarding that helps users understand and access value immediately, using CRM channels like email and push to reinforce the benefits over time, and segmenting signals to spot disengagement before it becomes churn. Offering discounts can work in win-back campaigns, but it should be balanced with value-based engagement so you're not simply attracting low-intent subscribers.
My advice is clear: view retention as a continuum of value delivery, not a reaction to churn. When you invest in lifecycle messaging that anticipates and responds to user needs — instead of waiting for them to leave — you increase long-term value and deepen loyalty in a way that really moves the needle.
Weekly subscriptions cycle ~4× per user, yet total captured value rarely catches annual plans, which lock in the full year upfront.
Cancellation rates for weekly plans concentrate in the first 14 days — much of which is buyer's remorse, not product failure. Saving these subscribers requires speed: catch the cancel intent inside the same week, not the same month.
A 90-day commitment gives the product enough time to deliver value, while still giving the team multiple touchpoints to re-engage before renewal. Quarterly plans show the lowest "post-onboarding regret" cancel rate.
The best practices we're seeing in Web2App funnels turn cancellation moments into insight engines: intelligent messaging that clarifies value, incentive structures that offer smart alternatives, and data capture that feeds back into product and pricing decisions.
My advice to teams is simple: don't just collect cancellations — analyze and act on them. Use cancellation prompts to ask why users are leaving, segment responses by intent, and feed that data into your roadmap. When you treat cancellations not as failures but as signals, you improve retention and empower your funnel to learn and evolve.
Payment-method maturity, dispute culture, and trust signals all shape regional refund risk. APAC's heavy Apple Pay share makes one-tap refunds frictionless; LATAM's card-heavy mix slows the cycle and suppresses requests.
Refund pressure scales with sticker shock. APAC and Europe lead because larger annual and quarterly charges show up on statements as line-item surprises — even when the user originally accepted the offer.
Refund risk is front-loaded. Catch the user inside their first week and you save almost half of what would otherwise leave. After 30 days, the risk effectively disappears — but median refund timing of ~1.6 days means save flows must trigger fast or not at all.
The bigger the upfront commitment, the bigger the regret window. Weekly plans hide refund risk inside their renewal cycle; annual plans concentrate it into one disputable line item — and disputed dollars show up first in chargebacks, second in support queues.
Payment infrastructure is now a growth lever.
Speed and convenience drive payment success. Reducing checkout friction has a direct impact on conversion.
- Payment authentication friction (3DS, bank challenges)
- Card declines and issuer restrictions
- Poor wallet availability or fallback options
- Network or gateway errors
Up to 17.5% of "failed" subscriptions are recovered through retry logic. Payment retries generate 15–20% revenue uplift on top of primary renewals.
Optimizing timing and messaging of the first three attempts captures the majority of recoverable revenue.
The ultimate web payments infrastructure.
- Process web payments without account blocks or fraud headaches
- Increase payment acceptance with smart routing
- Recover failed payments with retries, tokenization, and cascading
- Manage refunds and chargebacks across all PSPs in one place
- Full visibility and control over your billing stack
Supercharge your app growth.
The platform to launch, scale, and optimise web-to-app funnels.
Web2App in 2026, answered
What is Web2App?
Web2App is a user acquisition strategy where subscription apps acquire users through a web-based funnel — typically a quiz, paywall and checkout — rather than sending traffic straight to the App Store or Google Play. Users subscribe on the web, then download and sign in to the app. This gives teams full control over the funnel, the ability to A/B test rapidly, and the option to bypass app-store payment commissions.
What percentage of top-grossing apps use Web2App?
As of 2025, 82% of top-grossing mobile apps use Web2App funnels — nearly double the 2024 share. Adoption grew +77% year over year, making Web2App the default growth engine for leading subscription apps.
Which app categories ship the most Web2App funnels?
Health & Fitness leads by a wide margin with roughly 196 high-volume funnels (defined as >100 creatives per month) — about 5× the next category. EdTech, Lifestyle, Photo & Video, and Finance & Career follow. Within Health & Fitness, Fitness, Mental Health and Nutrition are the most active sub-verticals.
Which Web2App categories are growing fastest in 2025?
Finance & Career is projected at ~70% growth — the highest of any category. AI Tools, Language Learning and Astrology form the next tier at 12–22%. Most other categories cluster in single-digit growth.
How does web LTV compare to in-app LTV?
Web LTV typically outperforms in-app LTV across plan durations. Annual plans lock in revenue at month 1 (~$69 blended median LTV) and the all-plans blended path reaches ~$67 by month 12. App LTV is structurally lower in many subscription verticals due to store commissions (15–30%) and reduced pricing flexibility.
Where in the funnel do users drop off most?
The biggest drop happens before the paywall — during the quiz and onboarding phase — not at checkout. Optimizing pre-paywall flow (question count, perceived progress, value framing) consistently produces the largest conversion-rate lifts.
What plan duration retains best?
Plan duration reshapes the retention curve. Weekly plans decay steepest (100% → ~3% by month 12). Monthly plans hold ~10% by month 12. Quarterly plans show stair-step retention at renewal boundaries. Annual plans lock in the most revenue upfront but require strong onboarding to justify the commitment.
How is Web2App revenue distributed globally?
Of $60B+ in global Web2App revenue in 2025, the United States captures ~63.7%, Europe ~14.2%, APAC ~7.7%, with the remainder split across LATAM and MEA. The US lead is reinforced by the regulatory shift following Apple v. Epic, which expanded developers' ability to direct users to web checkout.
Why are payments a growth lever for Web2App?
Web payments — unlike in-app billing — let teams choose payment service providers, route by geography, support local payment methods (Apple Pay, Google Pay, regional rails), and tune retry logic. The result is materially higher authorization rates, lower fraud exposure, and net revenue gains that compound on top of funnel optimization.
What does "funnel scaler" mean?
A funnel scaler is a subscription app that operates a network of intent-driven Web2App funnels in parallel — each tuned to a specific motivation, persona, or creative angle — rather than relying on a single universal flow. Funnel scalers see ~176% YoY revenue growth and earn ~90% of their subscription revenue through the web.
What data sources back this report?
The State of Web2App 2026 draws on three independent sources: aggregated parsing of public global web funnels, the Meta Ads Library, and third-party ad intelligence. Apps included meet minimum traffic and revenue thresholds, plus apps using FunnelFox for funnel management and web payments. Data was processed in batches with added randomization; no individual user, account or session is identifiable in any chart.
Who published the State of Web2App report?
The State of Web2App 2026 is published by FunnelFox, a Web2App funnel management and web-payments platform. It is the first edition (Edition 01, January 2026) and the first global, data-backed view of how leading subscription apps build, price, and scale on the web.
Web2App terms, defined
- Web2App
- An acquisition model in which subscription apps acquire users through a web funnel (quiz, paywall, checkout) before the user downloads the app. Lets teams iterate quickly, A/B test, and own the payment relationship.
- Funnel scaler
- A subscription app that runs a network of intent-driven Web2App funnels in parallel, each tuned to a persona or motivation. Funnel scalers post ~176% YoY revenue growth in 2025.
- ARPU
- Average Revenue Per User — total subscription revenue divided by all users in a cohort, including non-payers. Useful for measuring acquisition efficiency end-to-end.
- ARPPU
- Average Revenue Per Paying User — revenue divided only by users who actually paid. Isolates pricing and plan-mix performance from conversion.
- LTV (Lifetime Value)
- The cumulative revenue a subscriber generates over their entire relationship with the product. In Web2App, LTV depends heavily on plan duration, retention curve, and refund/chargeback rate.
- Paywall
- The screen at which a Web2App funnel asks the user to pay. Paywall design (plan options, anchoring, social proof, urgency) is one of the highest-leverage points in the funnel.
- Quiz funnel
- An onboarding pattern that asks the user a sequence of personalization questions before showing a tailored paywall. Educates users, builds trust, and improves both conversion and downstream LTV.
- CR lift
- Conversion-rate lift — the percentage improvement in checkout conversion from a funnel change, A/B test, or pricing experiment.
- PSP
- Payment Service Provider — the vendor that processes card and alternative-payment transactions (e.g. Stripe, Adyen, Braintree). Multi-PSP routing maximizes auth rate by region and payment method.
- Cancel flow
- The in-product sequence shown when a user attempts to cancel a subscription. Well-designed cancel flows surface tailored offers and pause options that recover material revenue.