> ## Documentation Index
> Fetch the complete documentation index at: https://funnelfox.com/docs/llms.txt
> Use this file to discover all available pages before exploring further.
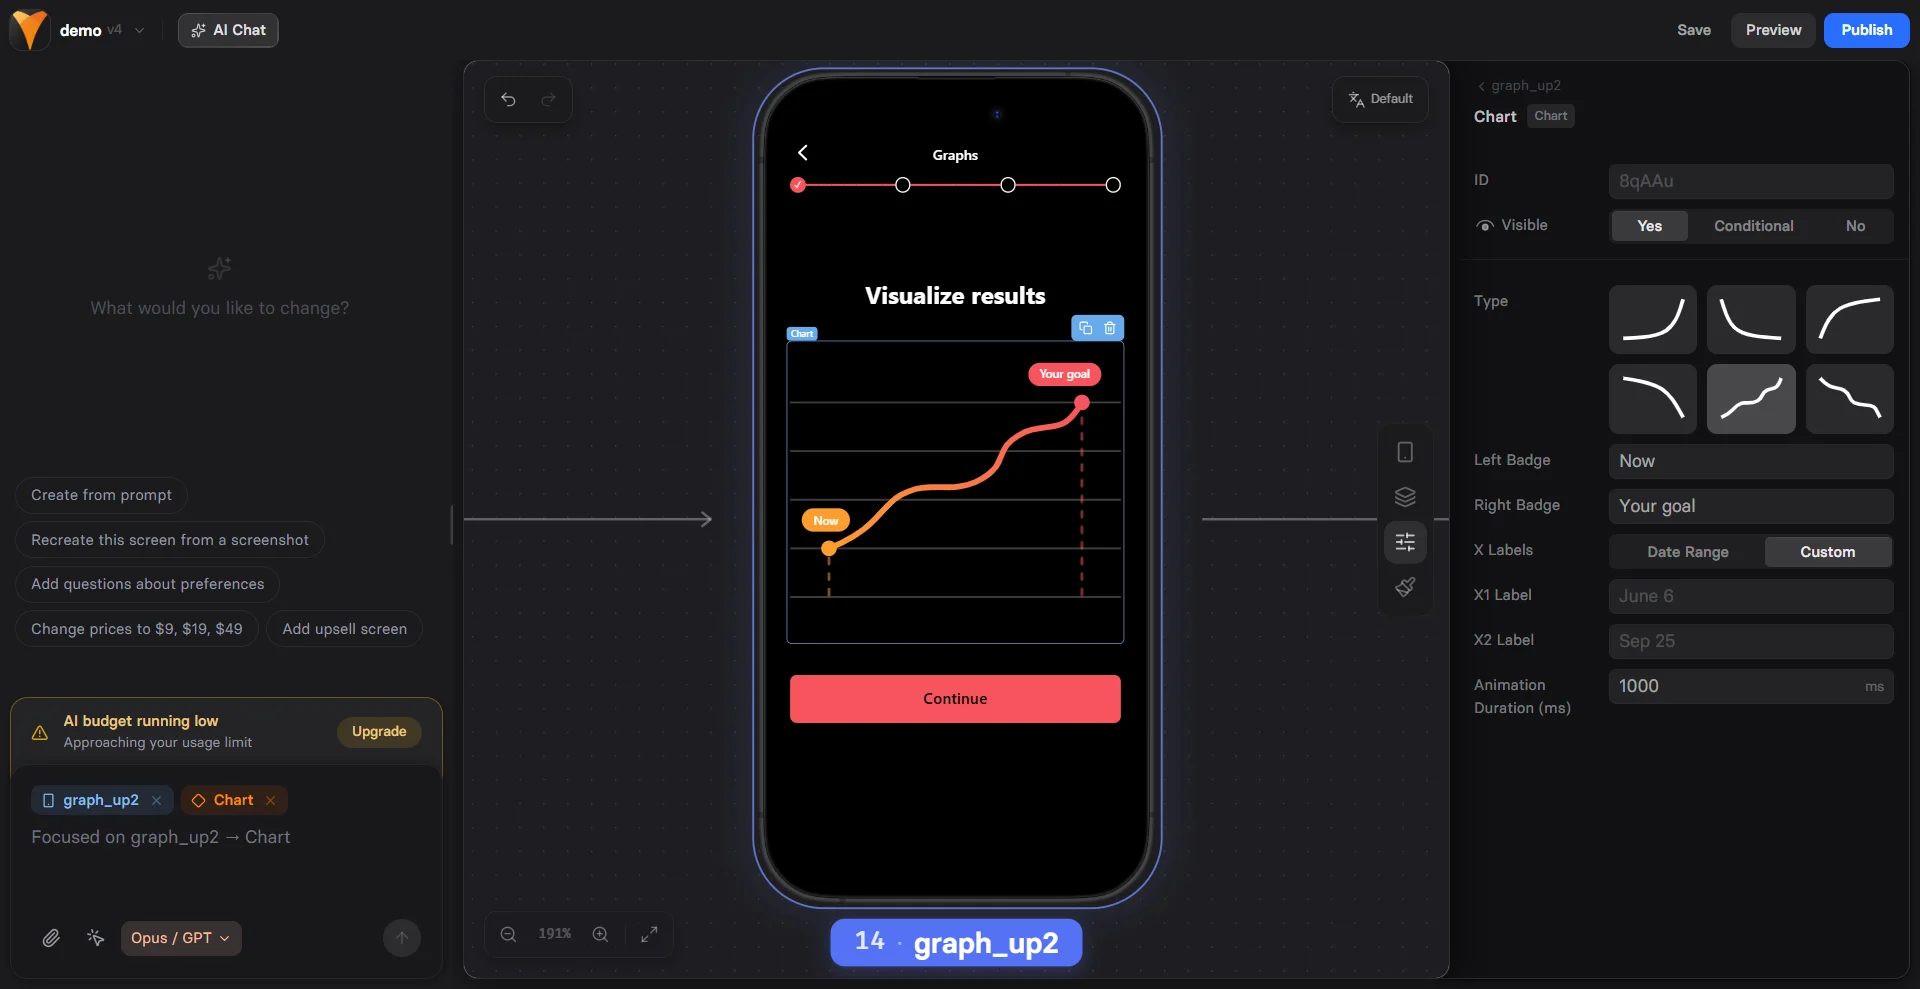
# Chart element
> Visual progress charts for building user commitment and showing potential outcomes
The Chart element creates compelling visualizations that help users imagine
their future success. By showing potential progress, you build emotional
investment before asking for commitment.
 ## When to Use
Perfect for:
* **Weight loss journeys** - Show potential progress over time
* **Learning curves** - Visualize skill development
* **Financial growth** - Display savings or earnings potential
* **Fitness progress** - Illustrate strength or endurance gains
* **Habit tracking** - Demonstrate consistency benefits
Charts work best after collecting user data (goals, current state) to
create personalized visualizations that resonate emotionally.
## Configuration
### Line Type
Choose your visualization style:
| Type | Best For | Visual Impact |
| ---------- | ------------------- | ---------------- |
| **Line** | Continuous progress | Smooth journey |
| **Bezier** | Natural growth | Realistic curves |
| **Step** | Milestone-based | Clear stages |
| **Area** | Volume/accumulation | Filled progress |
### Data Points
Define your chart's journey:
**Start Value**
* Current state or baseline
* Can use variables: `{{current-weight}}`
* Sets emotional starting point
**End Value**
* Goal or target state
* Shows achievable outcome
**Date Range**
* Time period for transformation
* Today to future date
* Creates urgency and realistic timeline
### Visual Elements
**Badges**
Add context at specific points:
```
Start: "Today: {{weight}} lbs"
End: "Goal: {{target-weight}} lbs"
```
Badges support variables for personalization.
**Animation Duration**
Chart draws itself on screen:
* `1000ms` - Quick reveal
* `2000ms` - Dramatic build
* `3000ms` - Slow emphasis
Longer animations (2-3 seconds) create anticipation and give users
time to process the visualization.
## Creating Emotional Impact
### The Progress Principle
Charts leverage psychological principles:
1. **Visualization** - Seeing the journey makes it feel achievable
2. **Commitment** - Imagining success increases investment
3. **Gap Awareness** - Shows distance between current and desired state
4. **Social Proof** - Implies others have succeeded
### Personalization Strategy
Most effective approach:
Use [Text Input](/elements/textinput) or [Options](/elements/options):
"What's your current weight?"
"What's your target weight?"
Chart from `{{current}}` to `{{target}}`
"Your 90-day transformation"
"Start your journey today"
[Checkout](/elements/checkout) or [Plan Picker](/elements/planpicker)
## Common Patterns
### Weight Loss Funnel
```
Start: {{current-weight}}
End: {{target-weight}}
Duration: 90 days
Badge Start: "Day 1: {{current-weight}} lbs"
Badge End: "Day 90: {{target-weight}} lbs 🎉"
Type: Bezier (natural loss curve)
```
### Learning Progress
```
Start: 0
End: 100
Duration: 30 days
Badge Start: "Beginner"
Badge End: "Expert Level"
Type: Step (skill milestones)
```
### Savings Growth
```
Start: {{current-savings}}
End: {{current-savings + 5000}}
Duration: 12 months
Badge Start: "${{current-savings}}"
Badge End: "${{target-savings}}"
Type: Area (accumulated wealth)
```
### Fitness Journey
```
Start: {{current-pushups}}
End: {{current-pushups * 3}}
Duration: 60 days
Badge Start: "{{current-pushups}} pushups"
Badge End: "{{target-pushups}} pushups!"
Type: Line (steady progress)
```
## Mobile Optimization
Charts adapt beautifully to mobile:
**Responsive Scaling**
* Maintains proportions
* Touch-friendly interaction
* Clear label visibility
**Performance**
* Lightweight SVG rendering
* Smooth animations
* No layout shift
**Readability**
* Automatic font sizing
* High contrast colors
* Clear data points
## Combining with Other Elements
### Chart + Testimonial
```
Chart showing typical results
↓
Reviews element with success stories
"I lost 30 lbs in 90 days!"
```
### Chart + Timer
```
Chart showing potential progress
↓
Timer creating urgency
"Start your transformation in {{timer}}"
```
### Chart + Options
```
Options: "What's your goal?"
↓
Chart customized to selected goal
↓
Targeted offer based on goal
```
## Psychology Tips
### Make It Achievable
* Show realistic progress
* Use gradual curves, not steep lines
* Include minor setbacks for authenticity
### Create Anticipation
* Slow animation builds excitement
* Reveal chart after collecting goals
* Use ascending trends (up and to the right)
### Build Credibility
* Add "Based on average results" text
* Include disclaimer if needed
* Show realistic timelines
## Design Best Practices
### Color Psychology
* **Green** - Growth, health, money
* **Blue** - Trust, stability, calm
* **Orange** - Energy, enthusiasm
* **Purple** - Transformation, premium
### Visual Hierarchy
1. Chart dominates the screen
2. Clear start/end labels
3. Supporting text below
4. CTA button prominent
### Animation Timing
* Trigger on scroll into view
* Not too fast (loses impact)
* Not too slow (loses attention)
* Sync with other animations
## Testing Variables
A/B test these elements:
1. **Chart type** - Line vs Area
2. **Animation speed** - 1s vs 3s
3. **Personalization** - Generic vs Custom
4. **Timeline** - 30 vs 60 vs 90 days
5. **Badge text** - Different messaging
## Troubleshooting
* Check animation duration is set
* Verify chart is visible on page
* Look for JavaScript errors
* Test in different browser
* Use exact variable syntax `{{variable}}`
* Ensure variables are set before chart loads
* Check for typos in variable names
* Verify data is collected earlier in funnel
* Avoid very long date ranges
* Keep badge text concise
* Test actual mobile devices
* Check responsive breakpoints
* Verify start/end values
* Check variable calculations
* Ensure numeric values (not strings)
* Test with static values first
## Conversion Impact
Charts increase conversion by:
* **Visualization**: +15-20% when personalized
* **Commitment**: +10-15% emotional investment
* **Credibility**: +5-10% with realistic progress
Charts work best in the middle of funnels, after collecting user data
but before presenting offers.
## Advanced Techniques
### Multi-Chart Comparison
Show different scenarios:
```
Chart 1: "Without our program"
Chart 2: "With our program"
Visual contrast drives action
```
### Interactive Charts
Combine with inputs:
```
Slider: Adjust goal
Chart: Updates dynamically
Users explore possibilities
```
### Social Proof Integration
```
Chart: "Your potential progress"
Text: "Join 10,000+ achieving their goals"
Reviews: Success stories
```
## Next Steps
* [Collect user data](/elements/textinput) for personalization
* [Add testimonials](/elements/reviews) for credibility
* [Create urgency](/elements/timer) with timers
* [Present offers](/elements/checkout) after visualization
## When to Use
Perfect for:
* **Weight loss journeys** - Show potential progress over time
* **Learning curves** - Visualize skill development
* **Financial growth** - Display savings or earnings potential
* **Fitness progress** - Illustrate strength or endurance gains
* **Habit tracking** - Demonstrate consistency benefits
Charts work best after collecting user data (goals, current state) to
create personalized visualizations that resonate emotionally.
## Configuration
### Line Type
Choose your visualization style:
| Type | Best For | Visual Impact |
| ---------- | ------------------- | ---------------- |
| **Line** | Continuous progress | Smooth journey |
| **Bezier** | Natural growth | Realistic curves |
| **Step** | Milestone-based | Clear stages |
| **Area** | Volume/accumulation | Filled progress |
### Data Points
Define your chart's journey:
**Start Value**
* Current state or baseline
* Can use variables: `{{current-weight}}`
* Sets emotional starting point
**End Value**
* Goal or target state
* Shows achievable outcome
**Date Range**
* Time period for transformation
* Today to future date
* Creates urgency and realistic timeline
### Visual Elements
**Badges**
Add context at specific points:
```
Start: "Today: {{weight}} lbs"
End: "Goal: {{target-weight}} lbs"
```
Badges support variables for personalization.
**Animation Duration**
Chart draws itself on screen:
* `1000ms` - Quick reveal
* `2000ms` - Dramatic build
* `3000ms` - Slow emphasis
Longer animations (2-3 seconds) create anticipation and give users
time to process the visualization.
## Creating Emotional Impact
### The Progress Principle
Charts leverage psychological principles:
1. **Visualization** - Seeing the journey makes it feel achievable
2. **Commitment** - Imagining success increases investment
3. **Gap Awareness** - Shows distance between current and desired state
4. **Social Proof** - Implies others have succeeded
### Personalization Strategy
Most effective approach:
Use [Text Input](/elements/textinput) or [Options](/elements/options):
"What's your current weight?"
"What's your target weight?"
Chart from `{{current}}` to `{{target}}`
"Your 90-day transformation"
"Start your journey today"
[Checkout](/elements/checkout) or [Plan Picker](/elements/planpicker)
## Common Patterns
### Weight Loss Funnel
```
Start: {{current-weight}}
End: {{target-weight}}
Duration: 90 days
Badge Start: "Day 1: {{current-weight}} lbs"
Badge End: "Day 90: {{target-weight}} lbs 🎉"
Type: Bezier (natural loss curve)
```
### Learning Progress
```
Start: 0
End: 100
Duration: 30 days
Badge Start: "Beginner"
Badge End: "Expert Level"
Type: Step (skill milestones)
```
### Savings Growth
```
Start: {{current-savings}}
End: {{current-savings + 5000}}
Duration: 12 months
Badge Start: "${{current-savings}}"
Badge End: "${{target-savings}}"
Type: Area (accumulated wealth)
```
### Fitness Journey
```
Start: {{current-pushups}}
End: {{current-pushups * 3}}
Duration: 60 days
Badge Start: "{{current-pushups}} pushups"
Badge End: "{{target-pushups}} pushups!"
Type: Line (steady progress)
```
## Mobile Optimization
Charts adapt beautifully to mobile:
**Responsive Scaling**
* Maintains proportions
* Touch-friendly interaction
* Clear label visibility
**Performance**
* Lightweight SVG rendering
* Smooth animations
* No layout shift
**Readability**
* Automatic font sizing
* High contrast colors
* Clear data points
## Combining with Other Elements
### Chart + Testimonial
```
Chart showing typical results
↓
Reviews element with success stories
"I lost 30 lbs in 90 days!"
```
### Chart + Timer
```
Chart showing potential progress
↓
Timer creating urgency
"Start your transformation in {{timer}}"
```
### Chart + Options
```
Options: "What's your goal?"
↓
Chart customized to selected goal
↓
Targeted offer based on goal
```
## Psychology Tips
### Make It Achievable
* Show realistic progress
* Use gradual curves, not steep lines
* Include minor setbacks for authenticity
### Create Anticipation
* Slow animation builds excitement
* Reveal chart after collecting goals
* Use ascending trends (up and to the right)
### Build Credibility
* Add "Based on average results" text
* Include disclaimer if needed
* Show realistic timelines
## Design Best Practices
### Color Psychology
* **Green** - Growth, health, money
* **Blue** - Trust, stability, calm
* **Orange** - Energy, enthusiasm
* **Purple** - Transformation, premium
### Visual Hierarchy
1. Chart dominates the screen
2. Clear start/end labels
3. Supporting text below
4. CTA button prominent
### Animation Timing
* Trigger on scroll into view
* Not too fast (loses impact)
* Not too slow (loses attention)
* Sync with other animations
## Testing Variables
A/B test these elements:
1. **Chart type** - Line vs Area
2. **Animation speed** - 1s vs 3s
3. **Personalization** - Generic vs Custom
4. **Timeline** - 30 vs 60 vs 90 days
5. **Badge text** - Different messaging
## Troubleshooting
* Check animation duration is set
* Verify chart is visible on page
* Look for JavaScript errors
* Test in different browser
* Use exact variable syntax `{{variable}}`
* Ensure variables are set before chart loads
* Check for typos in variable names
* Verify data is collected earlier in funnel
* Avoid very long date ranges
* Keep badge text concise
* Test actual mobile devices
* Check responsive breakpoints
* Verify start/end values
* Check variable calculations
* Ensure numeric values (not strings)
* Test with static values first
## Conversion Impact
Charts increase conversion by:
* **Visualization**: +15-20% when personalized
* **Commitment**: +10-15% emotional investment
* **Credibility**: +5-10% with realistic progress
Charts work best in the middle of funnels, after collecting user data
but before presenting offers.
## Advanced Techniques
### Multi-Chart Comparison
Show different scenarios:
```
Chart 1: "Without our program"
Chart 2: "With our program"
Visual contrast drives action
```
### Interactive Charts
Combine with inputs:
```
Slider: Adjust goal
Chart: Updates dynamically
Users explore possibilities
```
### Social Proof Integration
```
Chart: "Your potential progress"
Text: "Join 10,000+ achieving their goals"
Reviews: Success stories
```
## Next Steps
* [Collect user data](/elements/textinput) for personalization
* [Add testimonials](/elements/reviews) for credibility
* [Create urgency](/elements/timer) with timers
* [Present offers](/elements/checkout) after visualization