> ## Documentation Index
> Fetch the complete documentation index at: https://funnelfox.com/docs/llms.txt
> Use this file to discover all available pages before exploring further.
# Analytics dashboard
> Track funnel performance in real time. Monitor revenue, subscriptions, conversion rates, and experiment results in the FunnelFox dashboard.
The [Analytics page](https://app.funnelfox.com/analytics) gives you deep
insights into how your funnels perform in real time. See what's working, identify
drop-off points, and make data-driven decisions to improve conversions.
Subscriptions data is available in Charts and Cohorts starting from June 17, 2025.
Analytics update continuously as visitors interact
with your funnels. All times are displayed in UTC+00:00 for consistency across
global teams.
## Key benefits
FunnelFox **Analytics** shows exactly how users move through your funnels,
where they drop off, and what drives revenue.
The Overview tab surfaces nine headline KPIs for any period — revenue,
subscriptions, sessions, and conversion — each with its change versus the
previous period.
Track conversion rates at every step, from the first screen to paywall,
checkout, and upsell.
Break down Net Revenue, ARPU,
and ARPPU by
funnel, product, or payment method.
Open any metric in Charts, group it by dimension, and explore the
breakdown in a sortable, exportable table.
## Overview
The **Overview** tab is the default tab of your [Analytics page](https://app.funnelfox.com/analytics).
It gives you a high-level, zero-setup snapshot of how your funnels perform.
 The Overview is built around one active metric. Select a KPI card at the top,
and the trend chart and breakdown table below update to show that metric.
The KPI cards are grouped into two rows:
* **Totals**: Net Revenue, New Subscriptions, Active Subscriptions, Sessions.
* **Rates & averages**: ARPU, ARPPU, Churn Rate, Start → Purchase,
Acceptance Rate.
Below the cards, the trend chart plots the active metric over time. The breakdown table
splits the active metric by a dimension you choose in **Group by**, where you
can show the **Top 5**, **Top 10**, or **All** rows, sort any column, and
export the view as a CSV file.
From here you can:
* [Filter](/dashboard/analytics#filters) your data.
* Choose the time range.
* Set the granularity to **Daily**, **Weekly**, or **Monthly**.
* Hover over any chart point to see more details.
Learn more about [metrics](/dashboard/analytics#metrics-explained).
## Charts
To explore a single metric in depth, go to **Analytics > Charts**.
The Overview is built around one active metric. Select a KPI card at the top,
and the trend chart and breakdown table below update to show that metric.
The KPI cards are grouped into two rows:
* **Totals**: Net Revenue, New Subscriptions, Active Subscriptions, Sessions.
* **Rates & averages**: ARPU, ARPPU, Churn Rate, Start → Purchase,
Acceptance Rate.
Below the cards, the trend chart plots the active metric over time. The breakdown table
splits the active metric by a dimension you choose in **Group by**, where you
can show the **Top 5**, **Top 10**, or **All** rows, sort any column, and
export the view as a CSV file.
From here you can:
* [Filter](/dashboard/analytics#filters) your data.
* Choose the time range.
* Set the granularity to **Daily**, **Weekly**, or **Monthly**.
* Hover over any chart point to see more details.
Learn more about [metrics](/dashboard/analytics#metrics-explained).
## Charts
To explore a single metric in depth, go to **Analytics > Charts**.
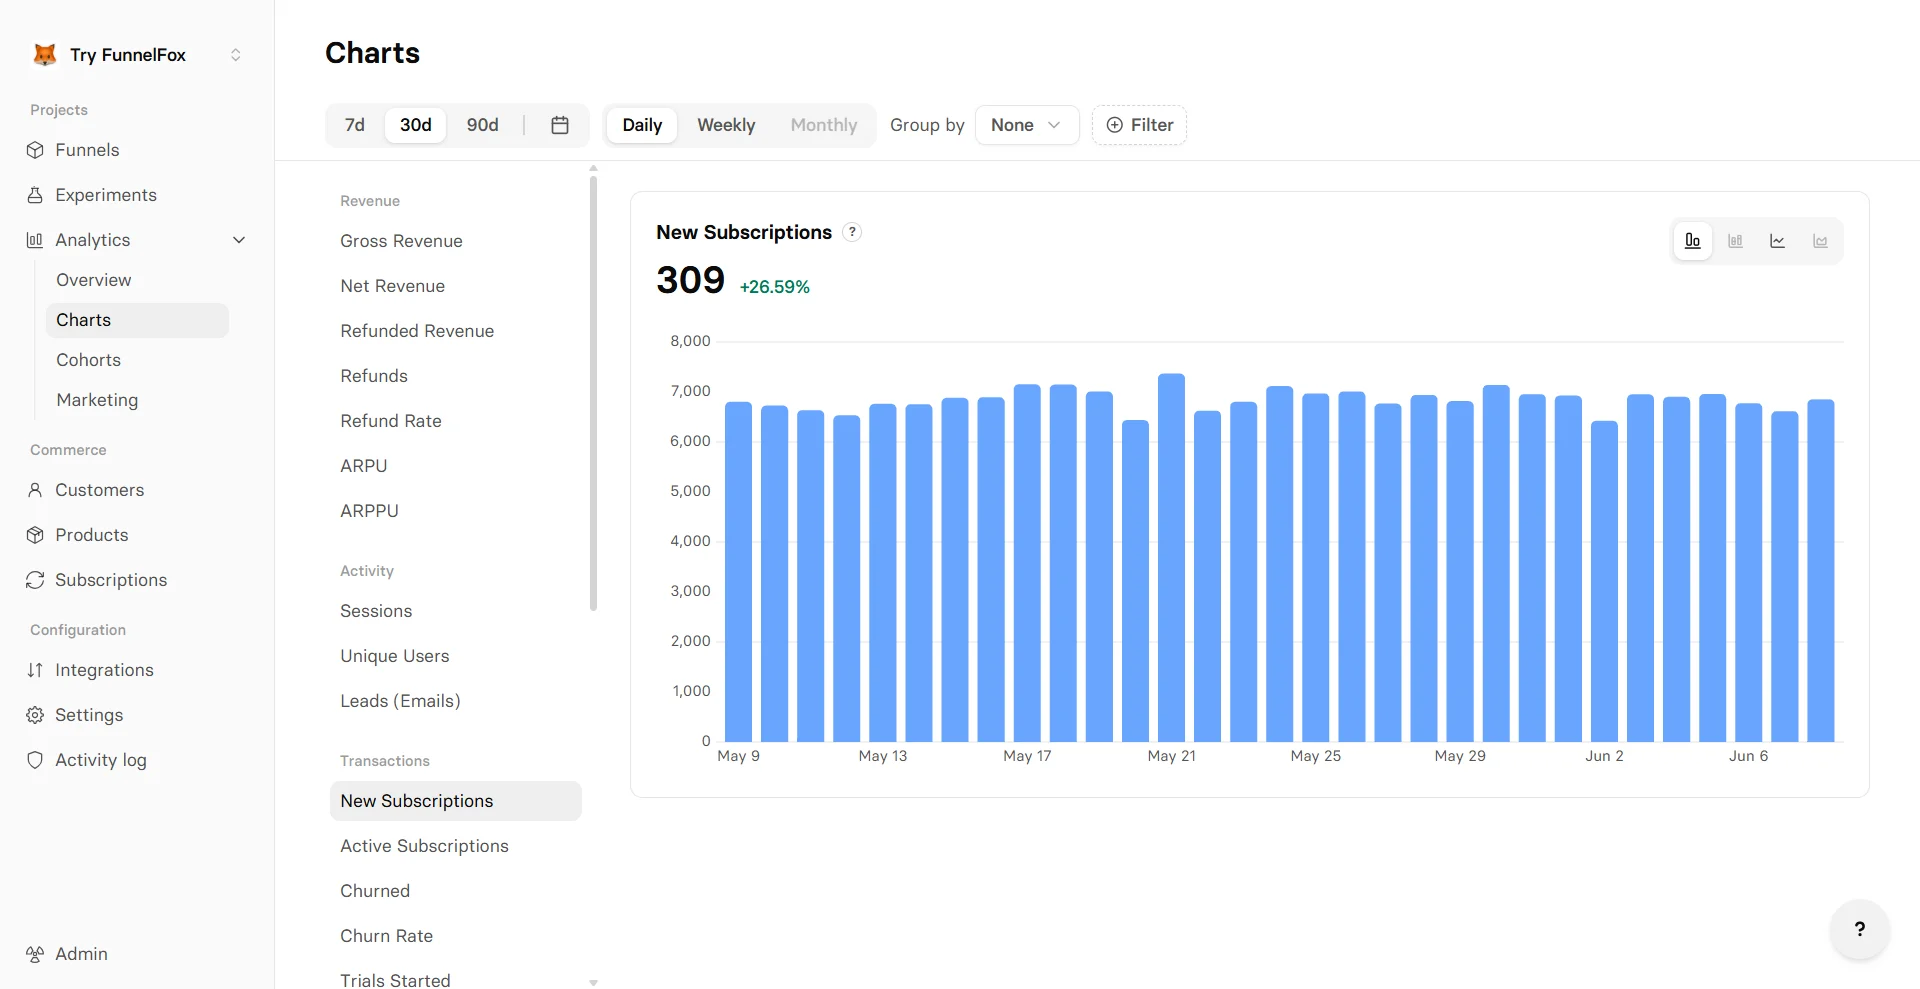 The **Charts** tab is the deep-dive view. Pick one metric from the selector on
the left, and the main area plots it as a time series.
The metric selector groups every available metric into four categories:
* **Revenue**: Gross Revenue, Net Revenue, Refunded Revenue, Refunds, Refund
Rate, ARPU, ARPPU.
* **Activity**: Sessions, Unique Users, Leads (Emails).
* **Transactions**: New Subscriptions, Active Subscriptions, Churned, Churn Rate, Trials Started, Trials Converted, Purchases, Payment Attempts, Upsell Revenue, Upsells.
* **Conversion rates**: By Step, Start → 2nd Screen, 2nd Screen → Email, Start → Purchase, Start → Subscription,
Start → Paywall, Paywall → Subscription, Checkout → Subscription,
Trial → Paid, Sub → Upsell.
From here you can:
* [Filter](/dashboard/analytics#filters) and [group](/dashboard/analytics#grouping) your data. Grouping also unlocks
the **Stacked bar** and **Stacked line** chart types.
* Choose the time range
* Set the granularity to **Daily**, **Weekly**, or **Monthly**
* Switch between **Bar** and **Line** chart types
Learn more about [metrics](/dashboard/analytics#metrics-explained).
## Cohorts
Cohorts is being redesigned. Updated documentation is coming soon!
To access the cohorts analysis, go to **[Analytics > Cohorts](https://app.funnelfox.com/analytics/cohorts)**.
With cohorts, you can track how each cohort's subscriptions and revenue perform after launch to measure retention and monetization.
The users are grouped in cohorts by the date they made their first transaction (subscription purchase, one-time payment or free trial). It then shows how each group performs over equal time periods (weekly or monthly) after that start date.
Learn how refunds, trials, one-time payments, upsells and cancellations impact [cohort attribution](/dashboard/analytics#cohort-attribution).
### Cohorts table
The **Charts** tab is the deep-dive view. Pick one metric from the selector on
the left, and the main area plots it as a time series.
The metric selector groups every available metric into four categories:
* **Revenue**: Gross Revenue, Net Revenue, Refunded Revenue, Refunds, Refund
Rate, ARPU, ARPPU.
* **Activity**: Sessions, Unique Users, Leads (Emails).
* **Transactions**: New Subscriptions, Active Subscriptions, Churned, Churn Rate, Trials Started, Trials Converted, Purchases, Payment Attempts, Upsell Revenue, Upsells.
* **Conversion rates**: By Step, Start → 2nd Screen, 2nd Screen → Email, Start → Purchase, Start → Subscription,
Start → Paywall, Paywall → Subscription, Checkout → Subscription,
Trial → Paid, Sub → Upsell.
From here you can:
* [Filter](/dashboard/analytics#filters) and [group](/dashboard/analytics#grouping) your data. Grouping also unlocks
the **Stacked bar** and **Stacked line** chart types.
* Choose the time range
* Set the granularity to **Daily**, **Weekly**, or **Monthly**
* Switch between **Bar** and **Line** chart types
Learn more about [metrics](/dashboard/analytics#metrics-explained).
## Cohorts
Cohorts is being redesigned. Updated documentation is coming soon!
To access the cohorts analysis, go to **[Analytics > Cohorts](https://app.funnelfox.com/analytics/cohorts)**.
With cohorts, you can track how each cohort's subscriptions and revenue perform after launch to measure retention and monetization.
The users are grouped in cohorts by the date they made their first transaction (subscription purchase, one-time payment or free trial). It then shows how each group performs over equal time periods (weekly or monthly) after that start date.
Learn how refunds, trials, one-time payments, upsells and cancellations impact [cohort attribution](/dashboard/analytics#cohort-attribution).
### Cohorts table
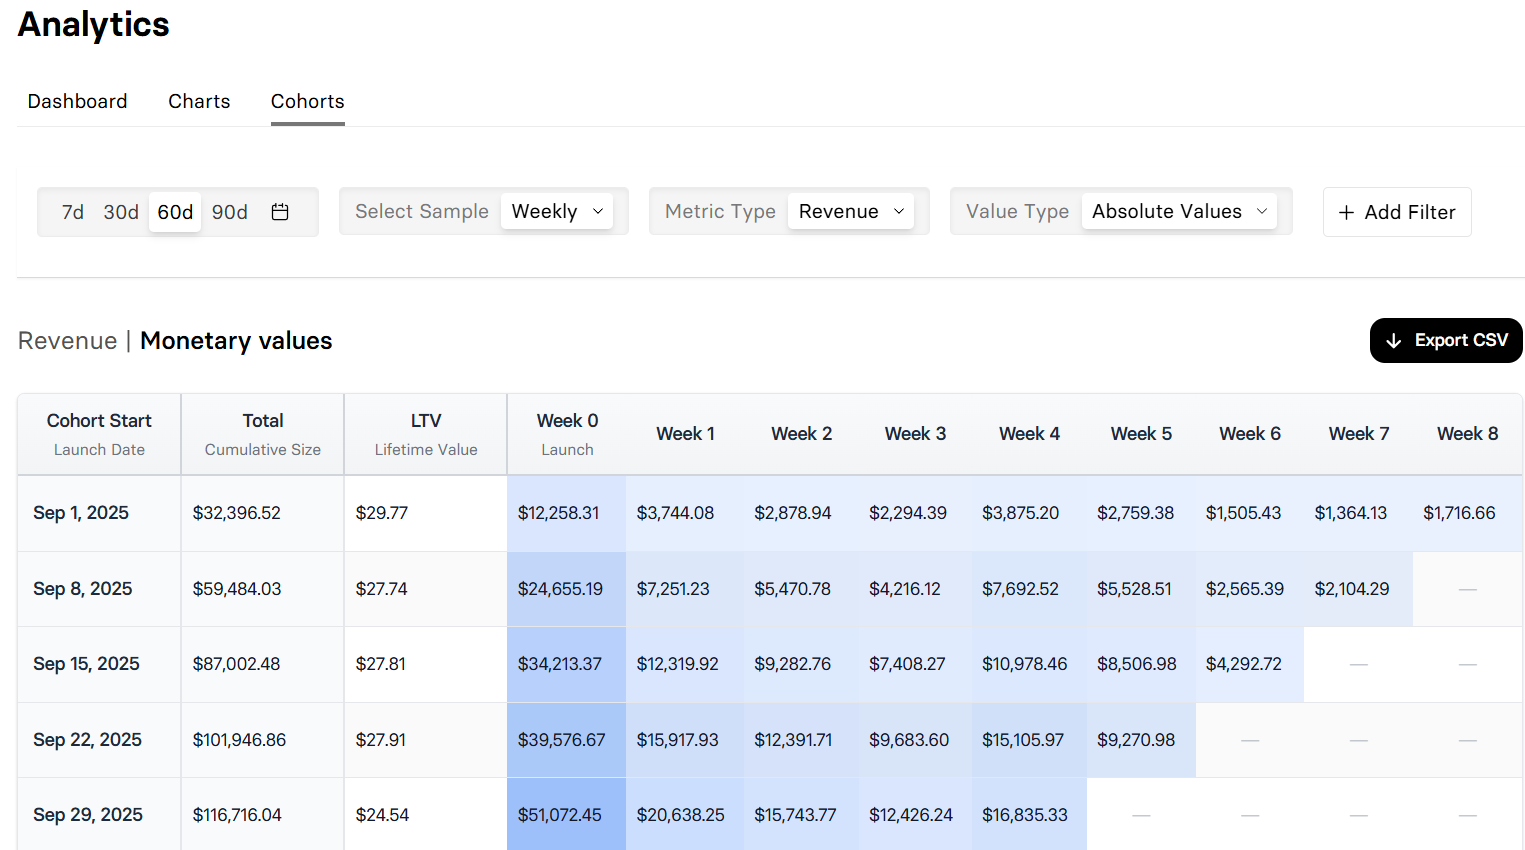 Here's what the cohorts table columns mean:
* **Cohort Start**: The launch date of the cohort when users made their first transaction.
* **Absolute Start**: The cohort’s initial size at launch (subscriptions or revenue). Available only when **Value Type** = **Relative (%)**.
* **Total**: Cumulative revenue for the cohort across all periods you’re viewing. Available only when **Value Type** = **Absolute**.
* **LTV**: Lifetime Value per user for the cohort. Calculated as **Total** ÷ **Cohort size**. Available only when **Metric Type** = **Revenue**.
* **Periods (Week or Month)**: Columns to the right show how each group performs over equal time periods after launch (with Period 0 = launch). The next periods show revenue from renewals and renewed subscriptions of the launched cohort.
* Cell color intensity (heatmap) is scaled against the maximum value in the table you’re viewing.
Here's what the cohorts table columns mean:
* **Cohort Start**: The launch date of the cohort when users made their first transaction.
* **Absolute Start**: The cohort’s initial size at launch (subscriptions or revenue). Available only when **Value Type** = **Relative (%)**.
* **Total**: Cumulative revenue for the cohort across all periods you’re viewing. Available only when **Value Type** = **Absolute**.
* **LTV**: Lifetime Value per user for the cohort. Calculated as **Total** ÷ **Cohort size**. Available only when **Metric Type** = **Revenue**.
* **Periods (Week or Month)**: Columns to the right show how each group performs over equal time periods after launch (with Period 0 = launch). The next periods show revenue from renewals and renewed subscriptions of the launched cohort.
* Cell color intensity (heatmap) is scaled against the maximum value in the table you’re viewing.
 To manage cohorts, you can:
* Switch between **Revenue** and **Subscriptions** in the **Metric Type** dropdown.
* Choose **Relative** and **Absolute** values in the **Value type** dropdown.
* Choose the time range.
* Customize rows to view cohorts weekly or monthly using the **Select Sample** dropdown.
* Add [filters](/dashboard/analytics#filters).
* Export the current cohorts view as a CSV file.
Compare older vs newer cohorts to see if changes to your funnel, pricing, or campaigns improved retention and revenue.
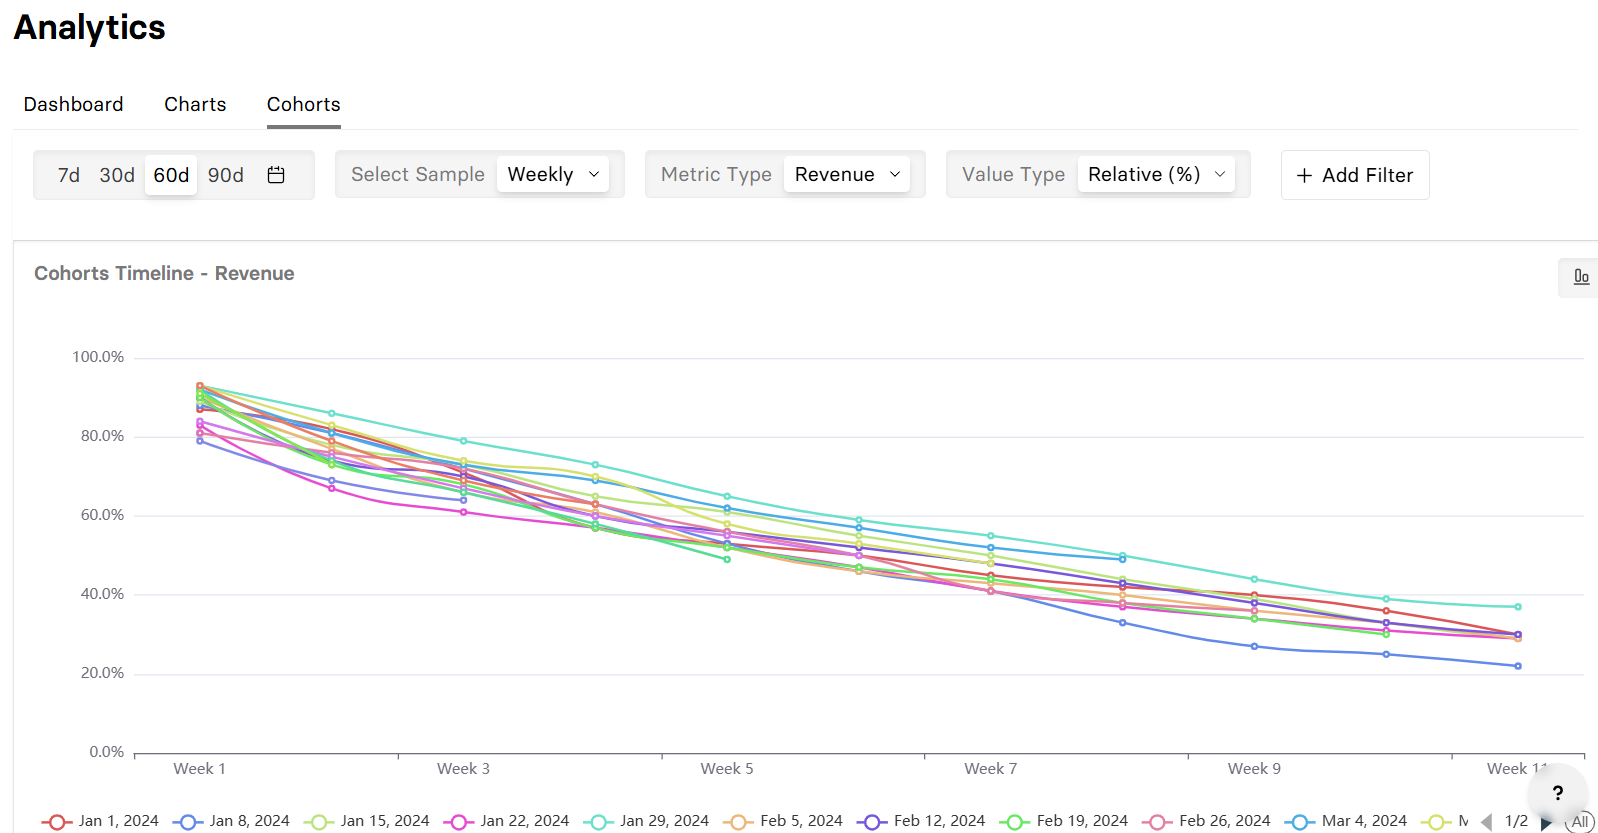
### Cohorts charts
Below the table, you’ll find two visualization options for analyzing cohort performance.
Shows each cohort from its launch and aligns their timelines (Week/Month 1, 2, 3…). Use this to see how subscriptions or revenue for each cohort change over time and spot retention/renewal trends.
To manage cohorts, you can:
* Switch between **Revenue** and **Subscriptions** in the **Metric Type** dropdown.
* Choose **Relative** and **Absolute** values in the **Value type** dropdown.
* Choose the time range.
* Customize rows to view cohorts weekly or monthly using the **Select Sample** dropdown.
* Add [filters](/dashboard/analytics#filters).
* Export the current cohorts view as a CSV file.
Compare older vs newer cohorts to see if changes to your funnel, pricing, or campaigns improved retention and revenue.
### Cohorts charts
Below the table, you’ll find two visualization options for analyzing cohort performance.
Shows each cohort from its launch and aligns their timelines (Week/Month 1, 2, 3…). Use this to see how subscriptions or revenue for each cohort change over time and spot retention/renewal trends.
 The X-axis lists cohorts; each series represents a specific period (Week/Month 1, 2, 3…). Use this to compare cohorts at the same point in their lifecycle (e.g., Week 4 across cohorts) and quickly spot improvements or regression.
 ### Cohort attribution
By default, data is attributed to a cohort once user made their first transaction (subscription, one-time payment or free trial). Here's how specific transactions impact cohort attribution:
* **Free trials**: Anchored to the cohort at the free-trial start even if the subscription is paid in the next week/month.
* If the subscription is paid in the next week/month, Period 0 has \$0 revenue, Period *n* shows the revenue, but the user counts as retained and no new cohort is started at the charge date.
* **Paid trials**: Anchored to the cohort at the paid-trial start even if the subscription starts in the next week/month. The paid-trial start = Period 0 and the user is retained there.
* **Renewals**: Stay in the original cohort. Credited to the matching Period n.
* **One-time payments & upsells**: Do not create a new cohort and are attributed to the same cohort in the week/month they occur.
* **Refunds & chargebacks**: Anchored to the week/month when refund happened. Reduces the revenue for the cohort period when the refund took place.
* **Subscription pause**: Stay in the same cohort. Periods while paused show \$0 revenue.
Subscriptions and revenue data in Cohorts may differ from the Analytics Dashboard and Charts due to the way upsells are attributed.
### Example
Here's what happens inside a cohort table:
A new row is created for everyone who paid the subscription in the chosen time window (day/week/month). Period 0 is the launch: in Relative (%) it’s always 100%; in Absolute it shows the actual amount for that period.
One time unit later, the next cell appears. It shows either the % of the launch value (Relative) or the raw amount (Absolute). 0%/0 means nothing happened; — means no data available yet.
As time passes, more cells fill in to the right. Darker shading indicates higher values, lighter indicates lower values. Newer rows have fewer filled periods until they age.
Use Relative (%) to compare cohorts fairly (each starts at 100%). Switch to Absolute to see actual amounts and identify the highest-earning cohorts.
## Metrics explained
Analytics tracks the following metrics across the **Overview** and **Charts**
tabs. The Charts selector groups them into four categories.
### Revenue
Total revenue from all purchases before any refunds, chargebacks, or fees
are deducted.
Gross Revenue minus refunds and chargebacks. Refunds can arrive up to 30
days after purchase, so recent amounts may adjust.
Total amount refunded in the period. Includes full and partial refunds
processed by the payment provider.
Number of individual refund transactions. One purchase can generate multiple
partial refunds.
Refunded revenue divided by gross revenue for the period. Higher rates may
indicate product or billing issues.
Average Revenue Per User. Total revenue divided by unique users who started
the funnel, including both paying and non-paying users.
Average Revenue Per Paying User. Total revenue divided by unique paying
users — how much each paying user spends on average.
### Activity
Total number of sessions (visits) in the period. One user can have multiple
sessions.
Distinct users who opened the funnel at least once. Deduplicated by user
identifier across sessions.
Email addresses captured through funnel forms. Counted once per unique email
per period.
### Transactions
New paying subscriptions started in the period. Includes converted trials
and direct purchases.
Total subscriptions currently active (paid and trial). Snapshot at the end
of each interval.
Subscriptions that ended in the period. Includes voluntary cancellations and
involuntary payment failures.
Churned subscriptions divided by active subscriptions for the period. Lower
is better. Voluntary = the user cancelled; involuntary = the payment failed.
New trial subscriptions started. Counted when the trial begins, regardless
of whether it later converts.
Trials that converted to a paid subscription. Counted on the date the first
paid charge succeeds.
All successful purchase transactions, including initial subscriptions,
renewals, and one-time payments.
Revenue generated from upsell offers accepted after the initial purchase.
Number of upsell offers accepted. Each accepted upsell counts once
regardless of amount.
### Conversion rates
Drop-off rate at each funnel step. Shows what percentage of users advance
from one step to the next:
* Bars show conversion relative to the initial screen.
* The line shows conversion relative to the previous screen.
* By default, the chart reflects the latest published funnel version.
By Step will be replaced by a dedicated funnel-analytics page.
Unique users who completed a purchase divided by unique users who saw the
first screen. How well your funnel converts traffic into paying customers.
Unique users who started a subscription divided by unique users who saw the
first screen. Measures end-to-end conversion from first visit to
subscription.
Unique users who reached the paywall divided by unique users who saw the
first screen. Shows how effectively early steps drive users toward pricing.
New subscribers divided by users who reached the paywall. Measures how well
your pricing page converts interested users.
Completed subscriptions divided by users who started checkout. Measures
payment form completion rate.
Trials converted to paid divided by total trials started. How well your
trial experience converts to paying customers.
Unique users who accepted an upsell divided by unique users who started a
subscription. Measures upsell conversion among subscribers.
## Set up tracking
### Screen type
For conversion rate analytics, mark your
[screen types](/editor/overview#param-screens) in the Editor. The
fastest way is to prompt AI Chat in Editor. Manual settings still work
if you prefer.
Funnels published before December 24, 2024 may have limited tracking.
Republish your funnels after configuring screen types to enable full
analytics capabilities.
Open your funnel and either prompt AI Chat in Editor (e.g.,
"Set this screen as a Paywall") or select each screen manually.
Available types:
* **Default**
* **Auth**
* **Checkout**
* **Finish**
* **Paywall**
* **Upsell**
Save and publish your funnel to activate tracking.
## Filters
To narrow results to those that matter for your decisions, you can filter data
on every **Analytics** tab by time range.
The **Overview** and **Charts** tabs share the same set of filters:
* Country
* Language
* Device
* OS
* Funnel
* Product
* UTM Source
* UTM Medium
* UTM Campaign
* Payment Provider
* Payment Method
* Currency
* Transaction Type
On the Charts **By Step** view, the **Funnel** filter is replaced by a dedicated funnel selector.
On the **Cohorts** tab, you can additionally filter data by billing period to view weekly or monthly subscription users only.
## Grouping
Grouping splits your data by a dimension so you can compare segments. Both the
**Overview** breakdown table and the **Charts** tab support grouping, with
different sets of dimensions.
* Billing Reason
* Browser
* Browser (with version)
* Card Type
* City
* Country
* Currency
* Device
* Experiment
* Funnel
* Language
* OS
* Payment Method
* Payment Provider
* Product
* Project
* UTM Campaign
* UTM Medium
* UTM Source
* Browser
* Browser (with version)
* City
* Device
* Funnel
* Language
* Project
* Experiment
* Currency
* Country
* Payment Provider
* Billing Reason
* Product
* OS
* UTM Campaign
* UTM Medium
* UTM Source
Each dimension applies only to relevant metrics. Options that don't apply to the selected metric are disabled.
## Troubleshooting
1. Check that your funnel is [published](/editor/publishing) (draft funnels don't track).
2. Note that subscriptions data is available in **Charts** and **Cohorts** starting from June 17, 2025.
3. Republish older funnels since funnels published before December 24, 2024 have basic tracking only.
Check the timezone. Analytics update continuously as visitors interact
with your funnels. All times are displayed in UTC+00:00 for consistency across
global teams.
1. [Set screen types](/dashboard/analytics#screen-type) properly in the Editor.
2. Republish funnel after changes.
## Next steps
Set up [Experiments](/dashboard/experiments) to test improvements.
### Cohort attribution
By default, data is attributed to a cohort once user made their first transaction (subscription, one-time payment or free trial). Here's how specific transactions impact cohort attribution:
* **Free trials**: Anchored to the cohort at the free-trial start even if the subscription is paid in the next week/month.
* If the subscription is paid in the next week/month, Period 0 has \$0 revenue, Period *n* shows the revenue, but the user counts as retained and no new cohort is started at the charge date.
* **Paid trials**: Anchored to the cohort at the paid-trial start even if the subscription starts in the next week/month. The paid-trial start = Period 0 and the user is retained there.
* **Renewals**: Stay in the original cohort. Credited to the matching Period n.
* **One-time payments & upsells**: Do not create a new cohort and are attributed to the same cohort in the week/month they occur.
* **Refunds & chargebacks**: Anchored to the week/month when refund happened. Reduces the revenue for the cohort period when the refund took place.
* **Subscription pause**: Stay in the same cohort. Periods while paused show \$0 revenue.
Subscriptions and revenue data in Cohorts may differ from the Analytics Dashboard and Charts due to the way upsells are attributed.
### Example
Here's what happens inside a cohort table:
A new row is created for everyone who paid the subscription in the chosen time window (day/week/month). Period 0 is the launch: in Relative (%) it’s always 100%; in Absolute it shows the actual amount for that period.
One time unit later, the next cell appears. It shows either the % of the launch value (Relative) or the raw amount (Absolute). 0%/0 means nothing happened; — means no data available yet.
As time passes, more cells fill in to the right. Darker shading indicates higher values, lighter indicates lower values. Newer rows have fewer filled periods until they age.
Use Relative (%) to compare cohorts fairly (each starts at 100%). Switch to Absolute to see actual amounts and identify the highest-earning cohorts.
## Metrics explained
Analytics tracks the following metrics across the **Overview** and **Charts**
tabs. The Charts selector groups them into four categories.
### Revenue
Total revenue from all purchases before any refunds, chargebacks, or fees
are deducted.
Gross Revenue minus refunds and chargebacks. Refunds can arrive up to 30
days after purchase, so recent amounts may adjust.
Total amount refunded in the period. Includes full and partial refunds
processed by the payment provider.
Number of individual refund transactions. One purchase can generate multiple
partial refunds.
Refunded revenue divided by gross revenue for the period. Higher rates may
indicate product or billing issues.
Average Revenue Per User. Total revenue divided by unique users who started
the funnel, including both paying and non-paying users.
Average Revenue Per Paying User. Total revenue divided by unique paying
users — how much each paying user spends on average.
### Activity
Total number of sessions (visits) in the period. One user can have multiple
sessions.
Distinct users who opened the funnel at least once. Deduplicated by user
identifier across sessions.
Email addresses captured through funnel forms. Counted once per unique email
per period.
### Transactions
New paying subscriptions started in the period. Includes converted trials
and direct purchases.
Total subscriptions currently active (paid and trial). Snapshot at the end
of each interval.
Subscriptions that ended in the period. Includes voluntary cancellations and
involuntary payment failures.
Churned subscriptions divided by active subscriptions for the period. Lower
is better. Voluntary = the user cancelled; involuntary = the payment failed.
New trial subscriptions started. Counted when the trial begins, regardless
of whether it later converts.
Trials that converted to a paid subscription. Counted on the date the first
paid charge succeeds.
All successful purchase transactions, including initial subscriptions,
renewals, and one-time payments.
Revenue generated from upsell offers accepted after the initial purchase.
Number of upsell offers accepted. Each accepted upsell counts once
regardless of amount.
### Conversion rates
Drop-off rate at each funnel step. Shows what percentage of users advance
from one step to the next:
* Bars show conversion relative to the initial screen.
* The line shows conversion relative to the previous screen.
* By default, the chart reflects the latest published funnel version.
By Step will be replaced by a dedicated funnel-analytics page.
Unique users who completed a purchase divided by unique users who saw the
first screen. How well your funnel converts traffic into paying customers.
Unique users who started a subscription divided by unique users who saw the
first screen. Measures end-to-end conversion from first visit to
subscription.
Unique users who reached the paywall divided by unique users who saw the
first screen. Shows how effectively early steps drive users toward pricing.
New subscribers divided by users who reached the paywall. Measures how well
your pricing page converts interested users.
Completed subscriptions divided by users who started checkout. Measures
payment form completion rate.
Trials converted to paid divided by total trials started. How well your
trial experience converts to paying customers.
Unique users who accepted an upsell divided by unique users who started a
subscription. Measures upsell conversion among subscribers.
## Set up tracking
### Screen type
For conversion rate analytics, mark your
[screen types](/editor/overview#param-screens) in the Editor. The
fastest way is to prompt AI Chat in Editor. Manual settings still work
if you prefer.
Funnels published before December 24, 2024 may have limited tracking.
Republish your funnels after configuring screen types to enable full
analytics capabilities.
Open your funnel and either prompt AI Chat in Editor (e.g.,
"Set this screen as a Paywall") or select each screen manually.
Available types:
* **Default**
* **Auth**
* **Checkout**
* **Finish**
* **Paywall**
* **Upsell**
Save and publish your funnel to activate tracking.
## Filters
To narrow results to those that matter for your decisions, you can filter data
on every **Analytics** tab by time range.
The **Overview** and **Charts** tabs share the same set of filters:
* Country
* Language
* Device
* OS
* Funnel
* Product
* UTM Source
* UTM Medium
* UTM Campaign
* Payment Provider
* Payment Method
* Currency
* Transaction Type
On the Charts **By Step** view, the **Funnel** filter is replaced by a dedicated funnel selector.
On the **Cohorts** tab, you can additionally filter data by billing period to view weekly or monthly subscription users only.
## Grouping
Grouping splits your data by a dimension so you can compare segments. Both the
**Overview** breakdown table and the **Charts** tab support grouping, with
different sets of dimensions.
* Billing Reason
* Browser
* Browser (with version)
* Card Type
* City
* Country
* Currency
* Device
* Experiment
* Funnel
* Language
* OS
* Payment Method
* Payment Provider
* Product
* Project
* UTM Campaign
* UTM Medium
* UTM Source
* Browser
* Browser (with version)
* City
* Device
* Funnel
* Language
* Project
* Experiment
* Currency
* Country
* Payment Provider
* Billing Reason
* Product
* OS
* UTM Campaign
* UTM Medium
* UTM Source
Each dimension applies only to relevant metrics. Options that don't apply to the selected metric are disabled.
## Troubleshooting
1. Check that your funnel is [published](/editor/publishing) (draft funnels don't track).
2. Note that subscriptions data is available in **Charts** and **Cohorts** starting from June 17, 2025.
3. Republish older funnels since funnels published before December 24, 2024 have basic tracking only.
Check the timezone. Analytics update continuously as visitors interact
with your funnels. All times are displayed in UTC+00:00 for consistency across
global teams.
1. [Set screen types](/dashboard/analytics#screen-type) properly in the Editor.
2. Republish funnel after changes.
## Next steps
Set up [Experiments](/dashboard/experiments) to test improvements.